Org-health tools tend to produce a grade — a letter, a percentage, a colour. Stood Flows produces a measurement, and the mechanic is simple to state: each business process is sliced and structured from a defined set of metadata that Stood Flows extracts, counts and sums, and every item is individually verifiable against the org. The method is not a score; it is a sequence that runs from “which processes still live at all” to “what the contract pays for them”, and the complexity score is one station on that line. Simpler CRM is the outcome the sequence serves: it exists to find the bloat and give its removal a number. The unit, the inputs, the windows and the known blind spots are published here, in full. Figures come from a synthetic five-org demonstration estate and are illustrative only; portfolio-level figures span the five orgs, and flagship-org figures are labelled as such.
Why the business process is the unit
Stood Flows measures the business process: one object combined with one record type. Not the org in aggregate, not the metadata component. The reasoning is practical. A metadata component — a validation rule, a lightning page — has no owner and no budget, so a finding attached to it has nowhere to land. An org-level grade has the opposite problem: owned by everyone, actionable by no one. A business process sits where accountability actually exists. “Concierge Intake Case” has a team that runs it, records that flow through it, seats that operate it and contract lines that pay for it. Roll structure, usage and cost up to that one unit and a finding becomes a decision someone can take. The demonstration estate resolves into 254 business processes across five orgs — few enough to review one by one, which an inventory of metadata components never is.
The method, station by station
The analysis runs the same arc every time, and each station feeds the next.
-
Business processes. Enumerate every object × record type combination that carries a stage or status — the backbone objects plus the custom objects that behave like them. This is the census: 254 business processes in the demonstration portfolio. Everything downstream attaches to this list.
-
Volumes, ghosts and stages. For each process: how many records, how many are ghosts, and how the rest distribute across the stages. A ghost record is a record whose stage value no longer exists in the picklist definition: it appears in no list view, no process, no report grouping — yet it exists and counts. Stage balance —
active/totalon every stage box in the Mapping view — shows which stages are warehouses and which are decorative. Most orgs have never been asked either question. The demonstration portfolio: 126 of 254 processes with no activity in the period, 47 with no records at all; in its flagship org, 2,721,733 ghosts against 17,643,827 backbone records. -
Structure. Each process is scored for complexity from seven counted inputs — the full score section is below. The point at this station is what the structure costs to understand: a new architect has to read every stage, profile, layout, page, rule, flow and trigger before touching anything.
-
Related objects. The KPI matrix shows, per record type, its related objects and their volumes. The extremes are what to question. Extremely low volumes usually mean a relationship that was never filled in — built, never adopted, and it does not matter. Extremely high volumes are often log or integration debris: machine-written rows nobody reads. The demonstration estate’s flagship org carries 108,576,580 related records around 17.6 million backbone records.
-
Apex. From each backbone trigger, walk the full class dependency tree — direct and transitive dependencies, sizes, and tags for record-type conditions, DML and SOQL, down to the source line. Cold classes are detected from event log files for the period analysed: no observed execution in that window. Audits relate to specific periods, and the period is stated on the figure — the claim is about what ran, not about what might. In the demonstration estate’s flagship org, 380 of the 1,150 classes present are cold over a two-week window — 33%. The figure hurts; it is the technical debt, and softening it would defeat the measurement. Note the two bases, because they are easy to conflate: the accretion chart counts classes created (cumulatively, 1,150 between 2017 and 2026) and the KPI view counts classes present (1,150 today). They agree because in nine years nothing was deleted.
-
In/out volumes. The same event log files record the org’s real traffic: the heaviest inbound and outbound requests and the API consumption behind them, ranked over a stated window. The finding is concentration — a few callers usually account for most of the volume, and the set rarely matches the architecture diagram.
-
DML and usage analysis. A CRM has to actionate concrete business; this station detects whether it does. Usage is read from DML in event log files — real logins, DbSave (database write) events, and which Apex entry classes actually run, to mention a few — never from login counts alone. Per process: who created and modified records in the window. Per user: what they wrote, and whether they come back — cohorts (daily, weekly, monthly, infrequent) over as much history as the org’s own event-log retention allows, up to 23 months in the demonstration estate, with login seasonality overlaid year on year. The write measure is the strict one; the login-based cohorts are the corrective that stops a short window from lying.
-
Licensing and cost valuation. The named-license funnel starts in the contract: provisioned (SELA) → assigned → logged in → active DML → No-Biz-DML / No-DML / integration. In the demonstration portfolio: 4,285 provisioned under the SELA, 3,512 assigned, 2,711 logged in over 30 days — and in the flagship org’s two-week DML window, 437 of 2,482 assigned users with business DML. The SELA itself is reconciled line by line — 102 lines across 9 orgs, unit lines, % add-ons and usage lines, mapped to the orgs that consume them — and the deactivation policy is simulated per org, against each org’s own rule (nothing is deactivated).
Each analysis is a versioned snapshot; run the arc again and every station reports its delta.
The complexity score
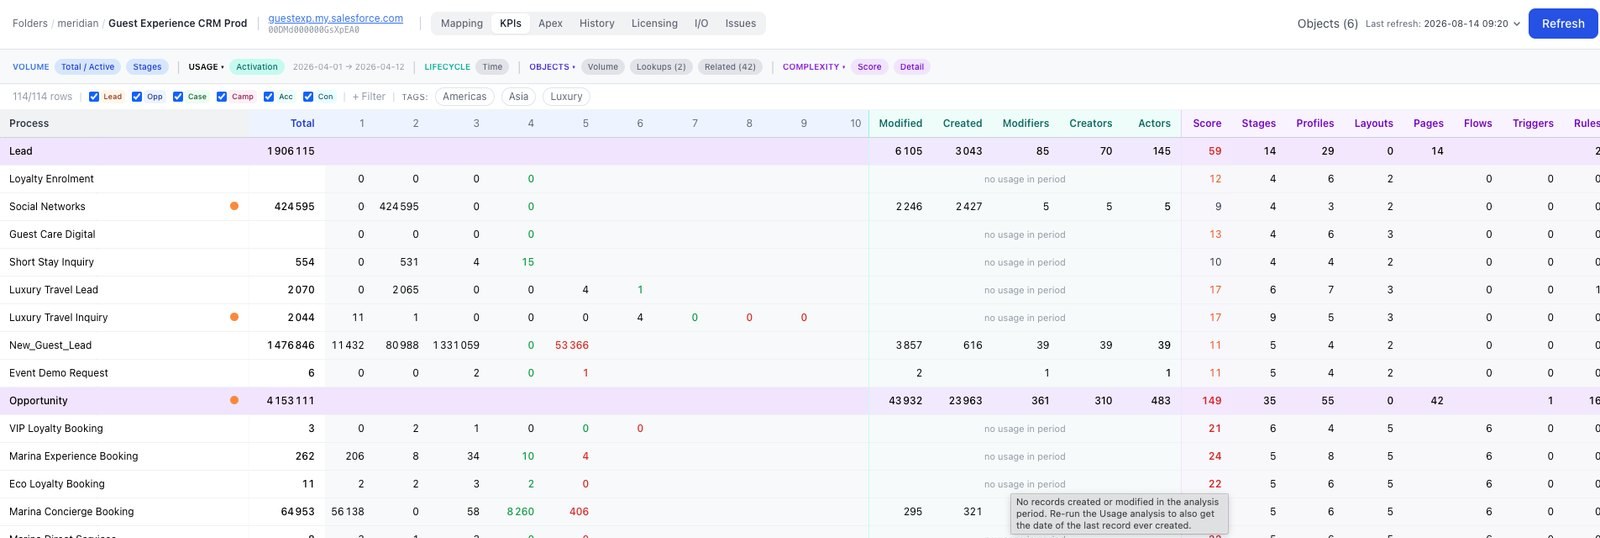
The mechanic runs extract → count → sum → verify → detect. Stood Flows extracts a defined set of metadata per business process, counts seven inputs — stages, profiles, layouts, lightning pages, validation and assignment rules, triggered flows, and Apex triggers — and sums them. The score is the plain sum of the seven counts. No weights, no model. Every item is individually verifiable against the org, through Setup or the CLI — which is what makes red zones detectable, and why the number is a measurement rather than a rating. A weighted model would smuggle opinion back into a number whose whole value is that it contains none: a plain sum lets you really see where you have missed settings and where security risks concentrate, because nothing in the arithmetic can hide them.
In the KPIs table, the score never appears alone — the COMPLEXITY → Detail toggle places the seven raw counts in columns beside it, so the arithmetic is on screen, not in a white paper.
| Process | Total | Ghosts | Active | Score | Stages | Profiles | Pages | Triggered flows | Triggers | Rules |
|---|---|---|---|---|---|---|---|---|---|---|
| Opportunity | 4,153,111 | 581,488 | 2,419,747 | 149 | 35 | 55 | 42 | 1 | 1 | 16 |
| Marina Concierge Booking | 64,953 | 91 | 56,196 | 24 | 5 | 6 | 6 | 0 | 0 | 0 |
| Eco Loyalty Booking | 11 | 2 | 7 | 22 | 5 | 6 | 6 | 0 | 0 | 0 |
| Lead | 1,906,115 | 2,033 | 1,850,699 | 59 | 14 | 29 | 14 | 2 | 0 | 2 |
| Luxury Travel Inquiry | 2,044 | 2,028 | 16 | 17 | 9 | 5 | 0 | 0 | 0 | 0 |
The score is the plain sum of the seven counts — checkable arithmetic. 5 of 108 processes shown · illustrative.
Illustrative rows from the demonstration org: Opportunity scores 149 (35 stages, 55 profiles, 42 lightning pages, 1 Apex trigger); Lead scores 59 (14 stages, 29 profiles, 14 lightning pages); child processes typically land between 10 and 24. No input is inferred, modelled or estimated. Each is a count you can verify against the org yourself, through Setup or the CLI.
Red zones are a judgment, not a threshold
A high score is not, by itself, a finding, and no fixed thresholds exist — Stood Flows publishes none because none would survive contact with a real estate. Thirty-five stages on Opportunity may be exactly what a global booking pipeline needs; a custom loyalty booking process scoring 22 while holding 11 records almost certainly is not. The product’s job is to surface the numbers side by side. The red zone is the analyst’s call, made reading the KPI table: right-click a row to raise an issue, and the finding enters the Issues backlog with the numbers attached. Where the estate is too large to read row by row, an agentic co-worker can be plugged in locally to massify the analysis — not included with the product, and its flags are raised as issues for the same human review. A red zone is where a right-sizing conversation starts; it is never an automatic action.
Definitions
Every derived term on this site has one meaning, stated here.
- Ghost records — records whose stage value no longer exists in the picklist definition: they appear in no list view, no process, no report grouping — yet they exist and count. The demonstration estate’s flagship org carries 2,721,733 of them against 17,643,827 backbone records.
- Zero-record — a business process with no records at all. Structure with nothing flowing through it.
- No activity — a business process with no records created or modified in the usage period. It may still hold millions of records.
- Active in period — the complement: at least one create or modify in the period.
- Cold classes — Apex classes with no observed execution in the event log files for the period analysed. The window is stated on the figure, always. The demonstration estate’s flagship org carries 380 cold classes of the 1,150 present, over a two-week window — 33%.
- No Biz DML — users who wrote to the org in the window, but only to objects excluded by the No-Biz rules — nothing that touches a business object. They hold a seat; they do not operate a process.
- Integration pattern — a user whose write behaviour matches an integration signature rather than a human one. This is a heuristic flag, applied so machine accounts are not misread as idle humans; it is reviewable, not authoritative.
- Provisioned — the named-license volume the SELA contracts for, before any seat is assigned in any org. The funnel starts here.
- Buffer — unassigned seats (total minus assigned) plus named-license users past that org’s no-login threshold, with exempt profiles excluded, counted to the org’s last licensing refresh. A buffer is not, by itself, waste: at renewal, unused entitlement is the only lever a customer holds, so the managed state is a deliberate buffer, sized and timed against the contract cycle — too much is money standing still, too little is leverage given away. The deactivation-policy simulation that feeds the figure releases nothing.
- Shelfware — the common word for SELA (Salesforce Enterprise License Agreement) entitlement paid for but not consumed: SKUs unmapped to any org, or seats that never reach an active user. The word assumes the answer is elimination; on this site the managed quantity is the buffer, defined above.
Analysis windows — and why they change the answer
Three windows govern the numbers, each stated wherever its result appears. The usage period is set per analysis (for example, 2026-04-01 to 2026-04-12) and drives activation and no-activity flags. Dashboard snapshots compare ~90-day windows (2026-04-16 to 2026-07-15 in the demonstration estate), smoothing process activity over monthly noise. Licensing DML runs on 14-day windows — event log file volume makes longer raw-DML windows impractical at enterprise scale.
A fourth constraint sits above all three: event-log depth is a property of your org. Event log file retention and the hourly detail behind it are licensed on the Salesforce side — Event Monitoring, typically through Shield — so the DML, cohort, cold-class and I/O windows can only be as long as the org’s own options allow. The scoping call establishes what is available, and a Quickstart answers it in the first hour. Structure, complexity, volumes and licence assignment are read from metadata and licensing objects, and do not depend on it.
Window choice changes results, and pretending otherwise would be dishonest. A quarterly forecasting process looks dead in a 14-day window and alive in a 90-day one; a month-end batch job inflates one fortnight and vanishes from the next. So every figure carries its window on screen, the cohorts view keeps 23 months of history on a trailing 28/30-day activity window, and login seasonality overlays the current year on the previous one — a seasonal trough reads as a trough, not as decline.
From Quickstart to re-measurement
A Quickstart walks the first steps in a couple of hours with one of our experts — a first scan and the shape of the analysis, not the whole arc; the first scoped project that follows runs it in earnest — the stations above, in order, on your own orgs, each producing insights your analysts qualify and raise as issues. The close is not a close: qualified issues become a right-sizing design in the System Design graph, reconciled against the SELA line by line, and re-measured at each snapshot — most customers run a monthly refresh, and technical debt decreases measurably across those snapshots. Stood Flows never writes to Salesforce (the architecture); your team, or your integration partner, acts on the org.
What the method does not capture
This is the section competitors do not publish, and the one an architect should read first.
- Semantic quality. The score counts structure; it cannot tell a well-designed validation rule from a harmful one, or thirty-five justified stages from thirty-five accidental ones. That judgement stays with your architects — the score tells them where to look, not what to conclude.
- Off-platform weight. Middleware, external services and code outside the org are visible only where they touch event log files as I/O or integration patterns.
- Event-log depth you do not license. Where an org has no Event Monitoring, the write-based usage, cold-class and I/O stations run shallow or not at all. We say so at scoping rather than at delivery.
- Declarative logic below the seven inputs. Formula fields and the internal logic of individual flows are fetched but not scored. Triggered flows enter the score as a count per process.
- Intent. A zero-record process may be next quarter’s launch. Every flag in Stood Flows is a question put to the org’s owners, not a verdict passed on them.
If a limitation you care about is missing from this list, tell us — the list is maintained, and the date at the top of this page is real.
Verify it yourself
The method is only worth publishing if you can run it. Book a demo and watch the seven counts checked against the demonstration org live, or start with a Quickstart and, in the first project that follows, scan an org you own and verify every count against Setup yourself — the method is the tooling that makes CRM simpler, and it is at its sharpest run monthly, against your own baseline.
All figures on this page are illustrative, drawn from a synthetic demonstration estate — not customer results or benchmarks.