Most org-analysis tools count metadata components. A component has no owner and no budget; a business process — one object, one record type — has both. The analysis leg of Stood Flows reads the estate in the order the questions come: which processes still live at all, which custom and related objects hang off them and at what weight, what their structure costs to understand, and what the code underneath actually ran. In the five-org demonstration portfolio used throughout this page, that is 254 business processes, of which 126 showed no activity in the analysis period and 47 hold no records at all. Illustrative figures from a synthetic estate, not customer results — but until you can see a process as a structure, you cannot say which parts of it are real.
Processes, volumes and stages
Which processes are real, and where the work actually sits, is the first thing a simplification plan needs. The map answers it directly: each business process laid out as its stages in sequence, with everything that acts on it attached to the place where it acts. Each stage carries an active/total count, so you can see where records actually sit, not where the design assumes they flow. Triggered flows appear as nodes connected to the stage they fire on. Validation rules are grouped alongside, each with the condition it enforces. Every record type shows its record count, so a process carrying eleven records is visibly not the same animal as one carrying 36,000.
Illustrative — 32,768 of 36,492 records rest in New; three stages hold nothing, ever.
Take the Concierge Intake Case process from the demonstration estate’s flagship org. Seven working stages, New through Closed, plus an Invalid terminal state. The counts tell the real story: 32,768 of 36,492 records sit in New. In Progress holds zero. Two mid-pipeline stages hold 2 and 3 records respectively. 392 records ended in Invalid. Structurally, this is a seven-stage process. Functionally, it is two: records enter New and, if they move at all, arrive at Closed. Everything in between is scaffolding — including the triggered flows and validation rules attached to stages nothing passes through. Each of those is maintenance surface, upgrade risk and onboarding confusion, spent on stages the business does not use.
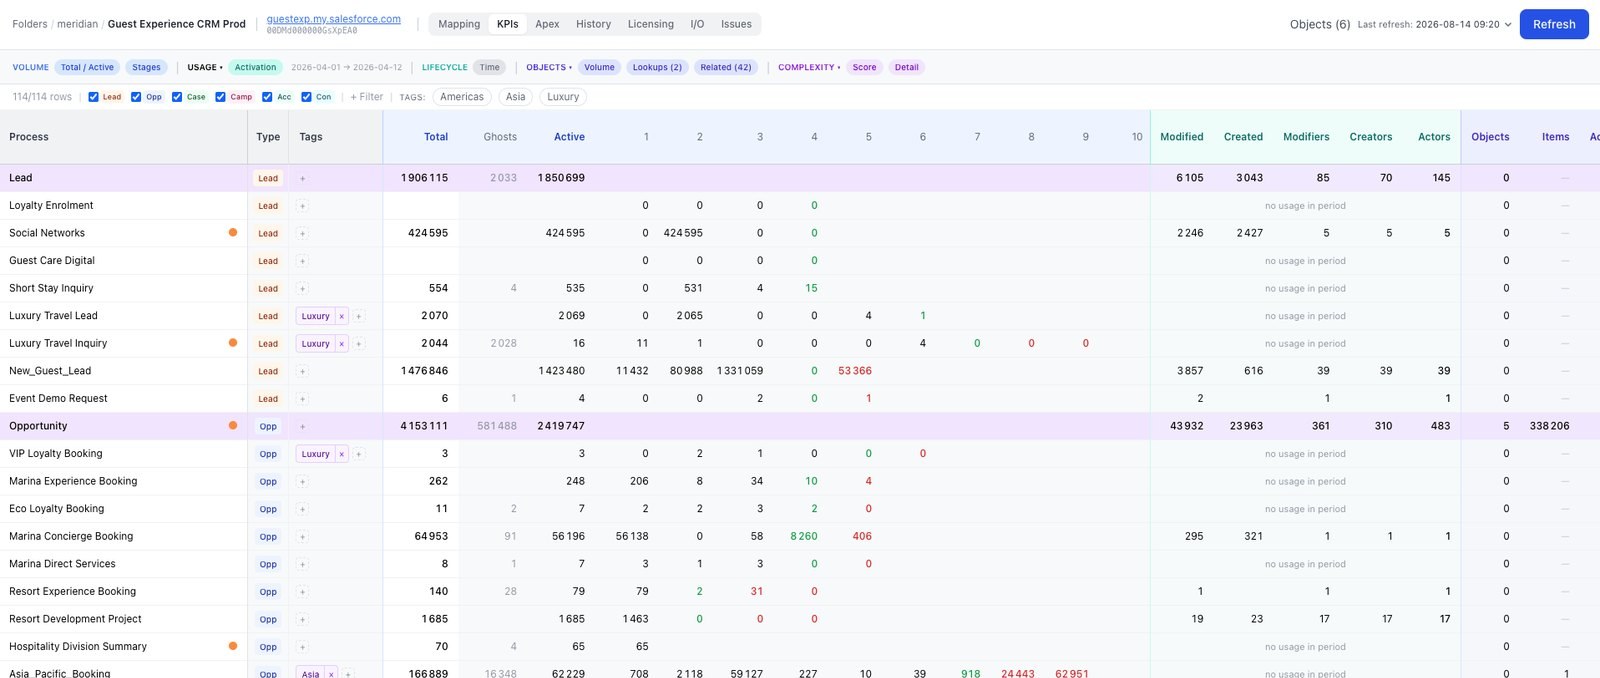
The volume columns separate total records from ghost records — records whose stage value no longer exists in the picklist definition, invisible to every list view, process and report grouping, yet present and counted (full definition). In the flagship org’s KPI totals row: 2,721,733 ghosts against 17,643,827 backbone records. And the table is honest about what it has not measured: a process with no records is marked zero-record; a process whose records simply were not touched inside the window is marked “no usage in period” — a different state, with a different meaning.
Related and custom objects: the extremes are the finding
Structure is not only stages and rules — it is what hangs off the process. Most of an org’s data weight sits outside the backbone, in the custom and related objects orbiting each business process, and the KPI matrix shows them per record type with their volumes beside them. The extremes are what to question, and both remedies are process decisions rather than code decisions. Related objects with unbalanced weight at the low end mean a relationship built and never filled in: the initial setup is no longer relevant, and someone can say so. At the high end the volume is usually machine-written debris — an integration logging every sync attempt, a survey tool storing every response and reminder. Around the flagship org’s 17.6 million backbone records sit 108,576,580 related records — better than six to one, and that is where storage bills, slow queries and migration estimates actually live. It is routinely several times the number anyone quotes in a steering committee.
Inside the record: the fields nobody fills
A process is not only its stages and the objects around it. It is also the form people are asked to fill in, and that form accretes. Every project that ever touched the org added fields to it; almost none removed any. The result is a record type whose layout asks for eighty things and whose users answer twelve — and nobody can say which twelve without opening a hundred records by hand.
Stood Flows states it per record type as a funnel of three counts. Allowed is the fields that record type’s users are permitted to see. Visible is the ones its layouts actually put in front of them. Unused is the visible fields filled on fewer than a set share of recent records — five per cent by default, movable on a slider, recalculated locally so you can find where the cliff is without re-reading the org.
The middle number is what makes the other two honest. Only fields somebody is actually shown get judged, because a field nobody is shown is a field nobody can fill, and counting it would describe the layout rather than the process.
Then the distinction that decides what the finding is worth: only your own custom fields can actually be deleted. A standard field can never be removed from Salesforce, and a managed-package field belongs to its publisher — for both, the only available move is taking them off the layout, which declutters the screen and frees nothing else. So the unused count carries the deletable subset beside it, and a cleanup estimate is never quietly inflated by fields nobody is able to remove.
At object level the question is asked field by field rather than in aggregate. A field is unused for the object only when every record type that shows it leaves it empty; a record type that does not show the field at all gets no vote. That sounds like a detail until you notice it is the difference between surfacing the abandoned fields and hiding them behind the record types that never displayed them.
What could not be measured is stated rather than folded in. A field the analysis was not granted read access to, a type the platform will not aggregate, a formula nobody fills by hand — each is listed with its reason and excluded from the count, because a removal list padded with “we could not tell” is worse than a shorter one.
Beside it sits a second, deliberately softer list: custom fields that appear on no layout at all. Nobody put them in front of anyone. That is not a deletion case on its own — an integration can write a field and a report can read it without it ever reaching a screen — but it is where an estate’s forgotten surface shows up, and it is free to look at.
This one reads the records themselves rather than event logs, so unlike cold classes and the I/O ranking it does not depend on the org’s Event Monitoring options. It does depend on what the analysis is allowed to read: fields it has no access to are reported as unmeasured, by name, rather than silently dropped.
Structure and complexity
What a structure costs to understand — and to maintain, test and one day untangle — is stated as a number. Every business process gets a complexity score built from seven counted inputs — stages, profiles, layouts, lightning pages, validation and assignment rules, triggered flows, and Apex triggers — shown as raw counts in their own columns, next to the score. The score is a plain unweighted sum you can recompute yourself; the methodology page publishes the full definition, the arithmetic and its limits. In the flagship org, Opportunity scores 149 (35 stages, 55 profiles, 42 pages), Lead scores 59 (14 stages, 29 profiles).
| Process | Total | Ghosts | Active | Score | Stages | Profiles | Pages | Triggered flows | Triggers | Rules |
|---|---|---|---|---|---|---|---|---|---|---|
| Opportunity | 4,153,111 | 581,488 | 2,419,747 | 149 | 35 | 55 | 42 | 1 | 1 | 16 |
| Marina Concierge Booking | 64,953 | 91 | 56,196 | 24 | 5 | 6 | 6 | 0 | 0 | 0 |
| Eco Loyalty Booking | 11 | 2 | 7 | 22 | 5 | 6 | 6 | 0 | 0 | 0 |
| Lead | 1,906,115 | 2,033 | 1,850,699 | 59 | 14 | 29 | 14 | 2 | 0 | 2 |
| Luxury Travel Inquiry | 2,044 | 2,028 | 16 | 17 | 9 | 5 | 0 | 0 | 0 | 0 |
The score is the plain sum of the seven counts — checkable arithmetic. 5 of 108 processes shown · illustrative.
The row that makes the whole argument is Eco Loyalty Booking: complexity 22, on eleven records. That is a fully-built process — stages, profiles, layouts, its own automation — serving a volume you could manage in a spreadsheet. No aggregate org-health score would ever surface it. A per-process table does, in one line.
Processes rarely mean anything in isolation, so the table segments them with tags — region labels such as Americas and Asia, tier labels such as Luxury — and filters by object. A regional director can read their own slice; a platform owner can compare tiers.
Code and executions: from trigger to tree
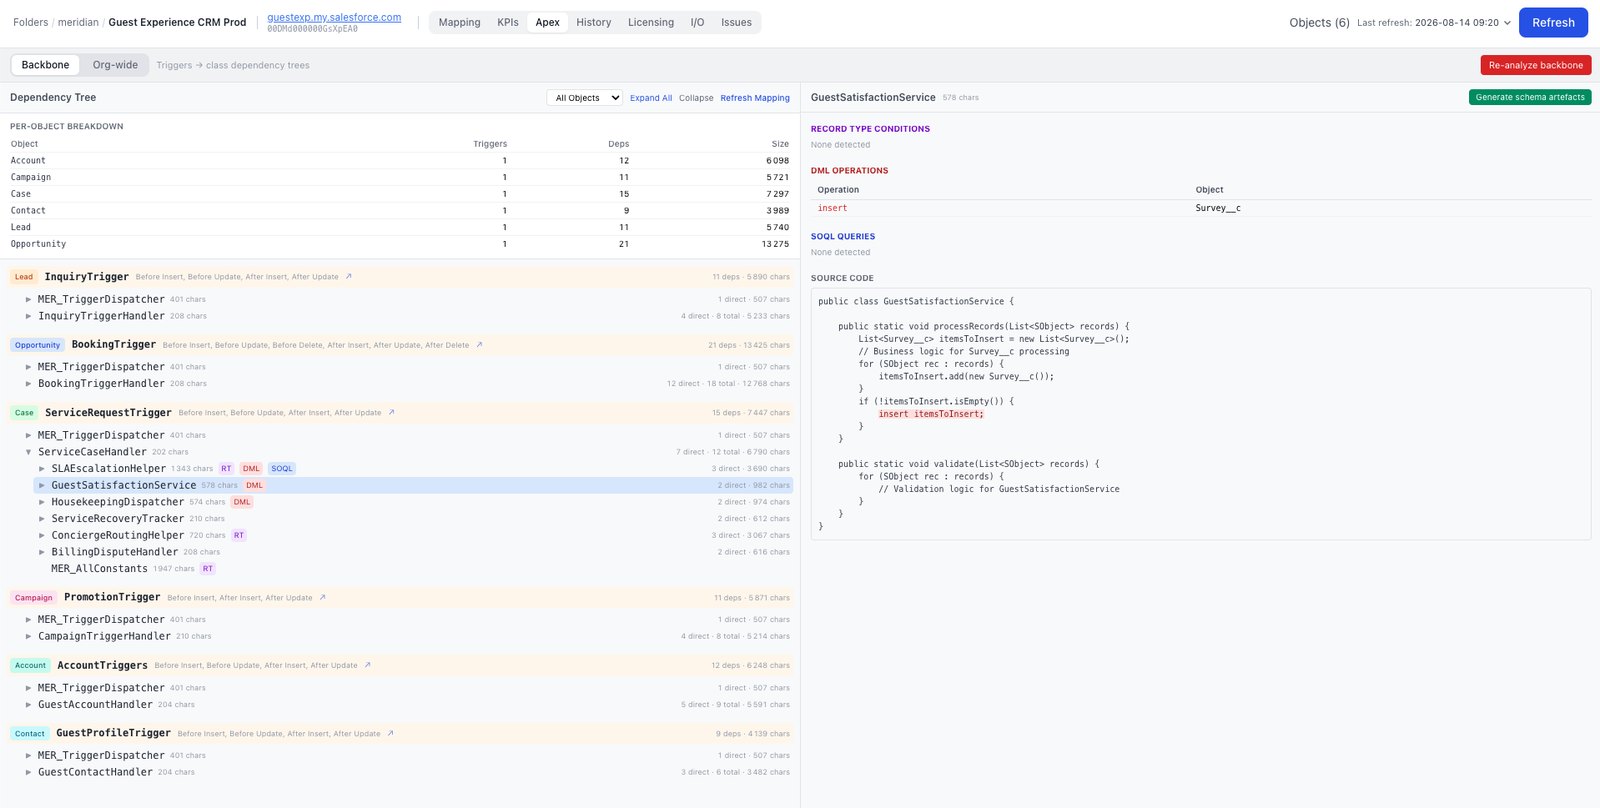
Nobody inherits documentation. In the flagship org you inherit 1,150 Apex classes and roughly 1,010,000 lines of org-wide code written by people who have left, and a standing instruction not to break Opportunity. The Apex view opens with a toggle — Backbone (the code reachable from triggers on your business objects) or Org-wide — and a per-object breakdown: triggers, dependencies, size in characters. Account carries 1 trigger, 12 dependencies, 6,098 characters; Case 1/15/7,297; Opportunity 1 trigger, 21 dependencies, 13,275 characters — one trigger, but the heaviest tree in the org.
Each trigger gets a card — the events it registers, its dependency count, its total characters — and below it the tree expands. Every node is a class, annotated with direct and transitive dependency counts and size, plus tags for what it carries: RT where it branches on record type conditions, DML where it writes, SOQL where it queries. Shared classes appear where they are shared — MER_TriggerDispatcher sits under every trigger, so the dispatcher pattern the original team built is visible as structure rather than tribal knowledge.
Click a class and the right panel answers the questions you would otherwise answer by reading source in another window: the record type conditions that gate the logic, the DML operations listed as operation plus object (insert → Survey__c), the SOQL queries, and the source code itself with the DML statement highlighted. Every tag on every node resolves to a line of Apex you can read on the spot.
Cold classes, ranked by weight
A cold class is one with no observed execution in the event log files for the period analysed. Audits relate to specific periods, and Stood Flows states the period on the figure: the claim is about what ran, not about what might. In the flagship org, 380 cold classes of the 1,150 present — 33% — across a two-week window. The figure is factual, read from the org’s own logs, and it hurts: it is the technical debt.
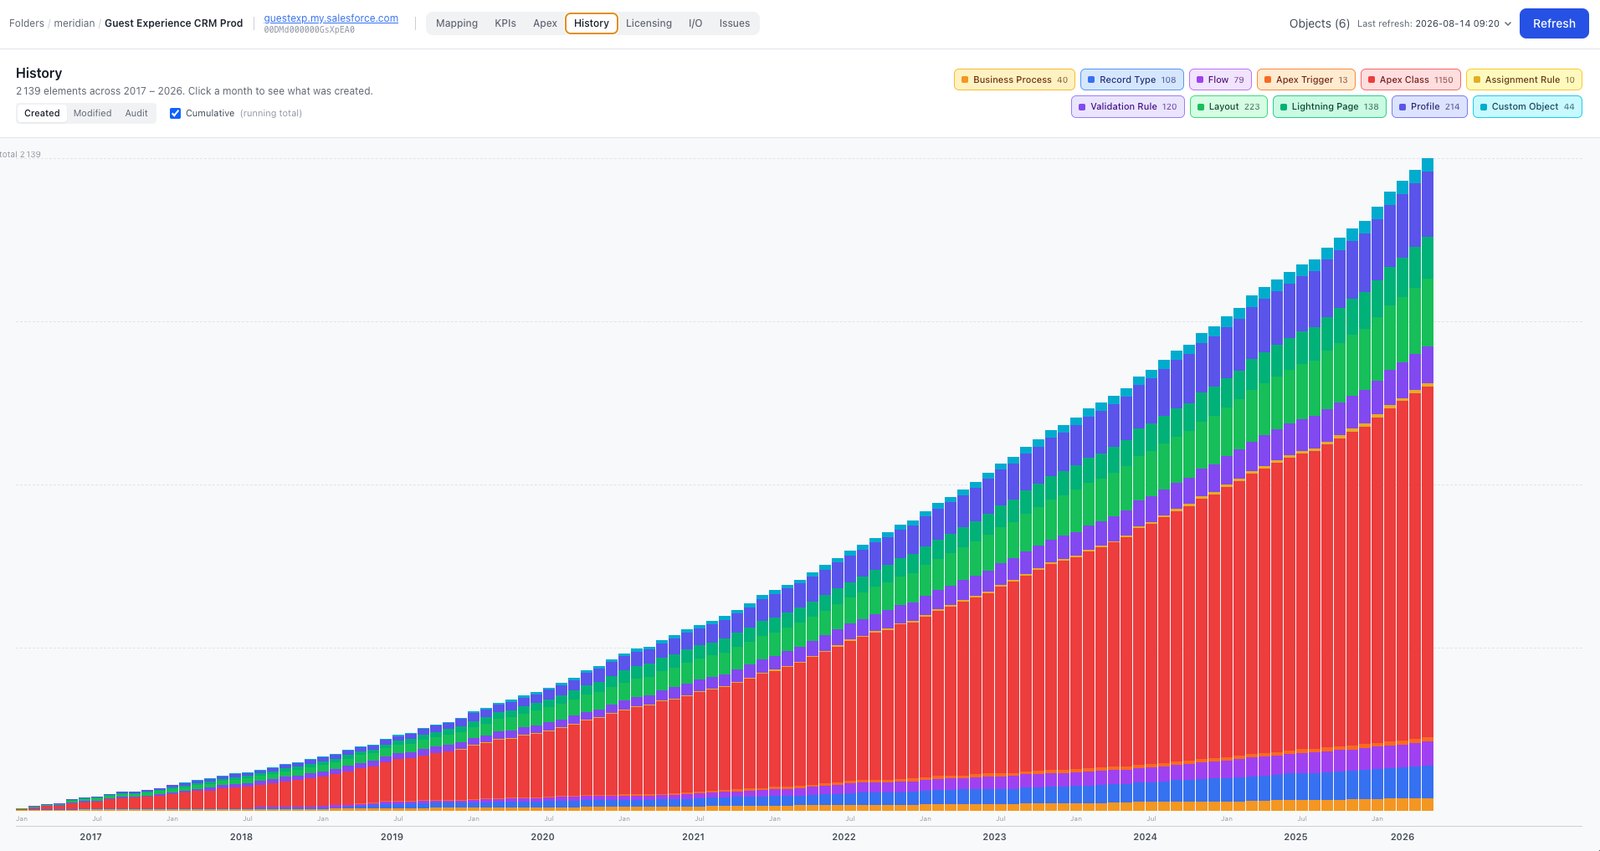
The accretion chart beside it counts a different thing, and the difference is the argument. It counts classes created — 1,150 of them between 2017 and 2026 — and it ends at the same number the org holds today, because in nine years nothing was ever removed. Created, cumulative; present, now: one number, because the line only ever goes up.
What your own logs can support is a property of your org, not of Stood Flows. Event log file retention and the hourly detail behind it are licensed on the Salesforce side — Event Monitoring, typically through Shield — so how far back the execution, usage and I/O analysis can look depends on the org’s own options. A Quickstart answers it in the first hour, and the scoping call establishes it before anything is promised on it. Structure, complexity and volumes do not depend on it.
The ranking matters as much as the list: candidates rank by dependency weight, not line count. A 4,000-character utility class referenced by nothing is a safe, cheap deletion. A 400-character class with fifteen transitive dependents is a structural decision. When tree work turns into design work, Generate schema artefacts exports the analysed structure in Stood’s sfschema format, documented in the documentation.
The flow estate: the other half of the logic
Apex is the half of the org’s logic that everyone is afraid of; the flow estate is the half nobody counts. They are built by people who are not developers, deployed without a release, and never inventoried — and every one of them is a step sequence that runs on someone’s save. The Flows view treats them as an estate: every active flow in the org, scored by step count and clustered by the object that triggers it, with the same two scopes as Apex — Backbone, the flows firing on the objects your processes run on, or Org-wide, everything. The flagship org carries 269 record-triggered flows as one of the seven inputs to its complexity score; the Flows view widens that to the whole active set and puts a weight on each one.
Step count is the structural half of the answer, and on its own it is a trap. A forty-step flow on a process that fires ten thousand times a day is the org working; a forty-step flow nobody triggers is a forty-step maintenance liability with no business behind it. So runtime comes from the event log files: how often each flow actually ran over the analysed window, how long it took, and how often it errored. Heavy and busy is a performance conversation. Heavy and idle is a removal conversation. Reading either number alone gets the decision backwards.
Cold flows are listed separately — active, deployed, and never executed in the window analysed. They are the flow estate’s equivalent of a cold class, and they read the same way: a factual statement about what ran in a stated period, not a prediction about what might. The same honest dependency applies as everywhere else that reads execution data — what your logs can support is a property of your org’s Event Monitoring options, not of Stood Flows.
Process Builder is flagged in red, as its own list. Salesforce stores those as flows, so they arrive in any inventory looking like ordinary autolaunched flows and hide in the count. Support ended on 31 December 2025, which makes every one of them a migration candidate carrying a date rather than a flow carrying a step count — a different decision, and one that belongs on a plan with a deadline on it.
In and out: the traffic
The architecture diagram says what should call the org; the logs say what does. The same event log files record the org’s real traffic: the heaviest inbound and outbound requests and the API consumption behind them, ranked over a stated window. The finding is concentration — a few callers usually account for most of the volume, and the set rarely matches the architecture diagram. Integrations added per project are never retired per project; the I/O view is where they surface.
An extraction or simplification decision needs all of this at once: the map tells you what is real, the score tells you what the structure costs, the volumes tell you what the data does, and the tree tells you what the code would drag with it. Stood Flows puts them in the same graph — read-only, with no cloud in the path: local by default, shared only through your own GitHub or S3, under Admin and Contributor roles (how).
Next in the arc: Usage & cost — who actually works in it, and what it costs →
All figures on this page are illustrative, drawn from a synthetic demonstration estate — not customer results or benchmarks. Portfolio figures span the five demonstration orgs; process, Apex and record figures are from the flagship org.