Every serious Salesforce customer runs more than one org, and every governance question — complexity, licenses, cost — is an estate question that gets answered one org at a time, in different formats, by different people. The folder-level Dashboard answers it once. Scope chips across the top select the global portfolio or any single org; the same cards re-render for whichever scope you pick. The demonstration estate used on this page is a synthetic five-org portfolio — 4,285 provisioned seats, 3,512 assigned, 254 business processes — and every figure on it is illustrative.
Scorecards, every one with its inputs showing
The dashboard carries eight cards today, and none of them is a bare number. Each carries a headline, a delta against the comparison baseline, sub-metrics, and a sparkline:
- Processes — 254 across the portfolio, with the sub-metrics that stop the headline lying: 126 with no activity, 47 zero-record, and the analysis window printed on the card.
- Backbone records — core record mass, with ghost and related records as sub-metrics, so growth that is really inert accumulation reads as exactly that.
- Complexity — the summed process scores, with triggered flows and profiles alongside; a rising score against a flat flow count means the existing automation is getting heavier.
- Apex — classes present, org-wide lines of code, and cold classes read from event log files with the window printed beside them. In the flagship org: 1,150 classes present, ~1,010,000 LOC, 380 cold over a two-week window — 33%, factual, and it hurts: it is the technical debt. The accretion chart counts classes created, and lands on the same 1,150, because nothing was ever removed.
- Licenses — Named — the funnel from contract to business write on one card: 4,285 provisioned under the SELA across the portfolio, 3,512 assigned, 773 unassigned entitlement — 18% — and 2,711 logins in 30 days, with active DML per org behind it. Unassigned entitlement is the buffer; what is releasable is a separate, qualified question the cascade answers rung by rung.
- Connected users — Named and Connected users — Community — engagement tiers: daily, weekly, others.
- Issues — open and resolved findings, snapshotted like everything else.
4 of 8 scorecards shown · portfolio scope, five orgs · vs previous snapshot · illustrative.
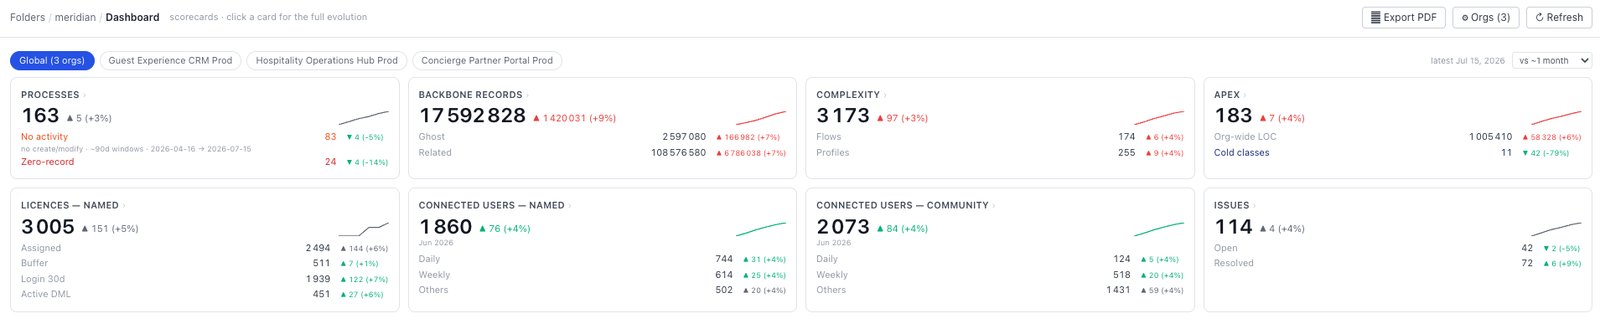
Click any card and it opens into the full evolution: a multi-line chart of the headline and sub-metrics across every snapshot, and a “By org · latest” stacked bar that splits the global figure by org — click a bar and you are in that org’s own tab. Global deltas strictly evaluate orgs with historical snapshots, so a newly onboarded org is never misreported as organic growth.
Snapshots, not recollections
A transformation programme is judged against where it started, so the record of where it started has to exist. Every refresh is a versioned snapshot — each org carries a Refresh action and its last-refresh timestamp, and usage and licensing analyses re-run over a date range you choose. Pick a baseline — the state of the estate when the programme was approved — and every KPI reports its evolution against it.
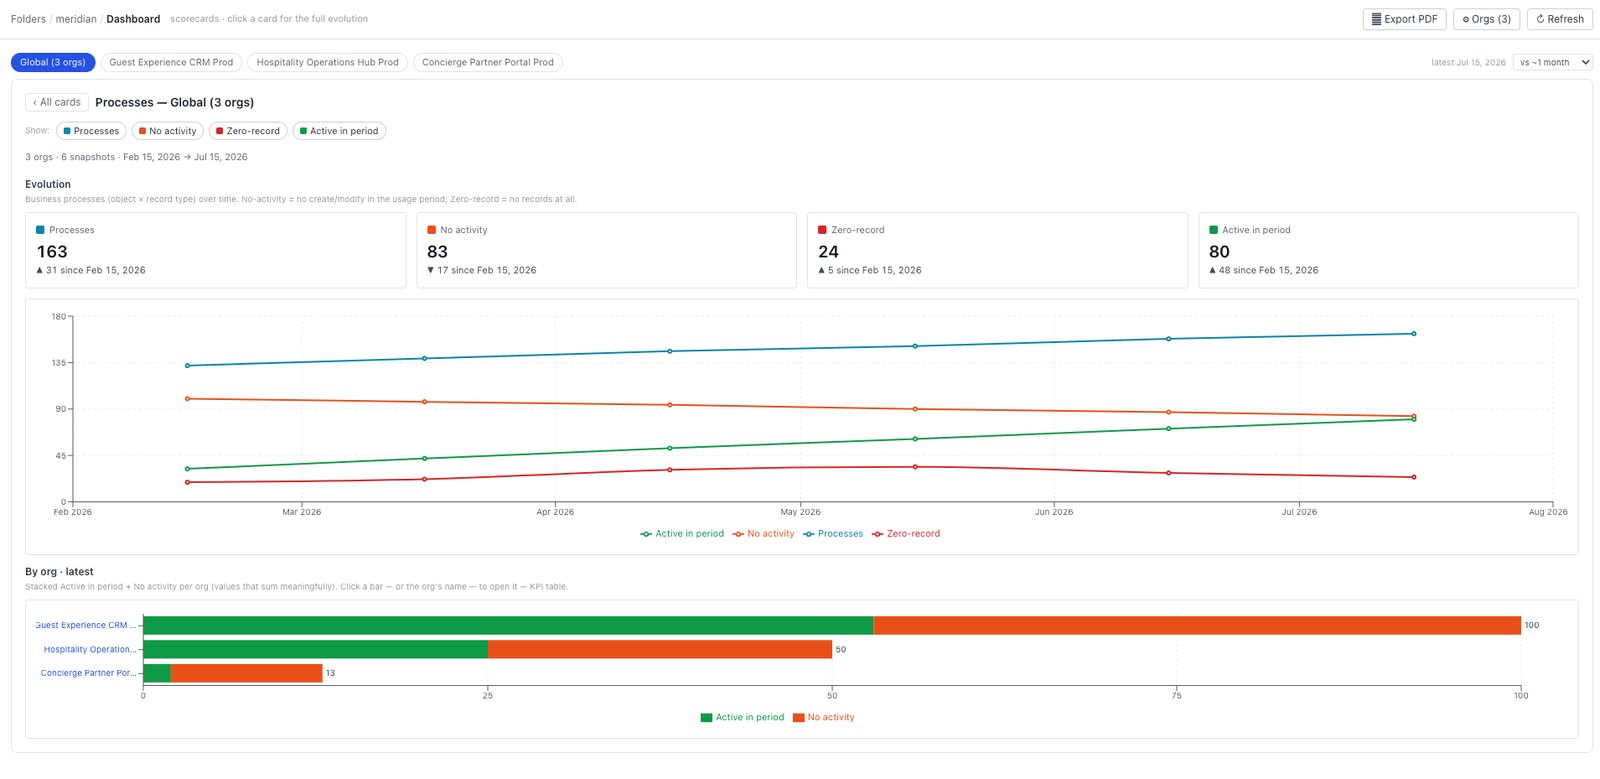
The demonstration portfolio holds monthly snapshots from February 2026, and the movement across them is the argument for the practice. Adoption roughly triples: processes active in the period grow from 45 to 128 while no-activity processes fall from 154 to 126 against a structure that grew from 199 to 254. Zero-record humps, then falls — from 45 up to 74 as new processes launch empty, back down to 47 as they fill: structure evolves; it is not just volume growth. And the buffer saw-tooths: provisioned seats step up on purchase dates while assigned grows smoothly between them, so the buffer jumps on a purchase and erodes as seats get taken up — the licensing cycle made visible. That saw-tooth is a governance artefact in its own right: it shows when the buffer was bought, how fast it erodes, and how much position remains — the shape you take into a renewal, not a point-in-time count.
│ Salesforce CLI · read-only · your credentials, your OS keychain
▼
Your Salesforce orgs — metadata, licensing, event log files. No connected app. No records extracted.
▼
Local files — json / sfschema on your machine
▼
Team sharing, when you enable it — your own GitHub or S3, Admin and Contributor roles. Nothing is sent to Stood.
This is what turns “are we getting better?” from a meeting into a number, with the definitions printed on the page it came from: “Business processes (object × record type) over time. No-activity = no create/modify in the usage period; Zero-record = no records at all.” Progress becomes a number, not an opinion — and the mechanism cuts both ways, deliberately: complexity that grew while the programme claimed simplification is equally visible.
The outlier the averages would hide
Portfolio scorecards exist to be drilled. In the demonstration estate the drill lands on Events & Catering Sales: a 56% buffer, 19 of its 26 business processes with no activity, 8 zero-record — money standing still, one business unit quietly paying for an org nobody adopted — while the flagship org runs a 12% buffer, thin going into a renewal. Both matter, because at renewal unused entitlement is the only lever a customer holds: a buffer of zero at the end of the term means no case to reduce the next commitment, and neither extreme is visible in an org-wide average. The deactivation-policy simulation then states, per org and per that org’s own rule, what enforcing the policy could release — and deactivates nothing.
Issues, tracked like a backlog
The product emits insights. Issues are raised from them by a human analyst reading the KPI tables — right-click a row — or by an agentic co-worker plugged in locally to massify the analysis (not included). The distinction is deliberate: no threshold engine is inventing work for you, so an issue on the board is one somebody qualified. From there they are counted on their own card and snapshotted like everything else. Comparing the open backlog against resolved throughput shows whether findings are actually being remediated: a finding raised in February either closed by July or is visibly still open.
One page for the people who don’t open the app
Export PDF produces the dashboard as a document for the people who will never install the tool: the CIO, the CFO, the renewal negotiation. Same cards, same deltas, same windows printed on them — nothing reformatted by hand between the analysis and the audience. For procurement and security review, the paperwork is equally short. There is no Stood cloud: the analysis is local by default and shared, when a team enables it, on the customer’s own GitHub or S3 under Admin and Contributor roles (the architecture). The procurement pack — DPA, subprocessor list, security architecture document — is available on request.
The continuous practice
Estates drift one org at a time. The practice that catches the drift is monthly: refresh every org, read the deltas against the baseline, work the issue backlog, and re-measure. Most customers run exactly this rhythm, and the technical debt curve bends measurably across snapshots — that is how the estate gets simpler, and how a transformation programme gets evidenced rather than asserted. The practice starts as a Quickstart — a couple of hours with one of our experts — and takes shape in a first scoped project that sets the baseline, the worklist and the rhythm; the rhythm then runs whether or not services support it. One-off assessments are possible, but the value compounds with continuity.
End of the arc. Back to the product overview, or see how the practice is priced.
All figures on this page are illustrative, drawn from a synthetic five-org demonstration estate — not customer results or benchmarks. Apex figures are flagship-org-level; seat and process figures are portfolio-level.