Login reports flatter every org. A user who opens Salesforce, glances at a dashboard and closes the tab counts as active. Stood Flows measures something stricter: DML — the inserts, updates and deletes that mean a person actually worked in a business process. A CRM has to actionate concrete business; this leg of the analysis detects whether it does, then connects the answer to the contract that pays for it. The CFO’s question — what are we paying for that nobody uses, and when does the renewal land — is the complexity question restated in dollars, and answering it starts with the usage, not the bill.
Scope note: the licensing analysis below is the flagship org, because a cascade only means something inside one contract population. Portfolio figures are labelled as such. Every level carries the window it was measured over — a 30-day login window and a two-week event-log window are different claims, and the page keeps them apart.
Usage from event log files: what people wrote, and whether they come back
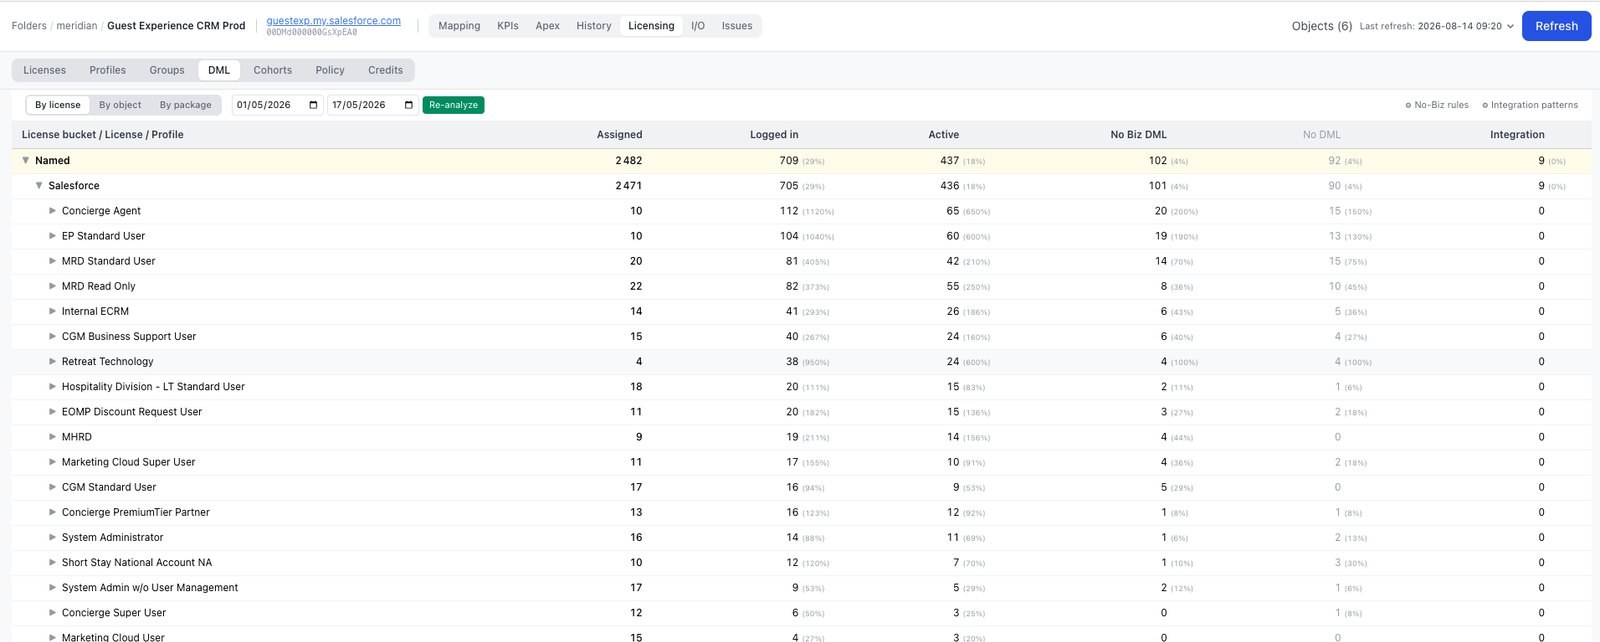
A seat decision only survives challenge if the usage behind it was measured, not asserted. The analysis runs on event log files — real logins, DbSave (database write) events, and which Apex entry classes actually run, to mention a few — and you can view the result by license, by object, or by package, drilling from license bucket to license type to profile. In every case the app reads operation counts, never record contents (what is and is not fetched).
Usage carries two dimensions, and a seat argument needs both. What people wrote is the strict measure: real business data operations, not just logins. Whether they come back is the corrective: the cohort and seasonality analysis is login-based by design, and it is what stops a two-week write window from lying about a quarterly process or a seasonal team.
One honest dependency. Event log file retention, and the hourly detail behind it, are licensed on the Salesforce side — Event Monitoring, typically through Shield — so what event-log depth is available depends on your org’s own options, not on Stood Flows. The scoping call establishes it, and a Quickstart answers it in the first hour. Licence assignment, buffer and provisioning are read from the licensing objects and do not depend on it.
The cascade: measured, and actionable
Two quantities, one scale. The funnel on the left is what the analysis measures — the named-license population narrowing from the contract down to the people who actually wrote to a business object. The ladder on the right is what is actionable: qualified rung by rung, each rung with its own threshold, its own owner and its own remedy.
The distinction matters because the gap is not the opportunity. Subtracting the bottom of the funnel from the top gives most of the estate, and no CIO can take that number anywhere. Adding up the qualified rungs gives a smaller number that survives a room.
Flagship org of the demonstration estate, on the provisioned scale. Login levels measured over a 30-day window; operation and business-write levels over a two-week event-log window; the 90-day rung uses the longer, safer threshold deliberately. Illustrative — synthetic estate, not customer results.
In the flagship org, the funnel reads: 2,817 provisioned on the contract, 2,482 assigned to a user, 1,936 logged in over the trailing 30 days, 622 with any recorded operation in the two-week event-log window — integrations included — and 437 who wrote to a business object. Every level is a population with a name, a count and a profile list behind it — Concierge Agent, MRD Read Only, System Administrator — so the conversation happens where seat decisions are actually made.
The ladder reads differently, because each rung is a decision rather than a measurement:
- Buffer — unassigned entitlement: 335 seats, 12%. Entitlement you hold and have not assigned. Its owner is procurement, and its remedy is to size and time it, not to spend it.
- No login in 90 days: 359 named users, exempt profiles excluded. Note the threshold: the funnel above measures a 30-day login window, and this rung deliberately uses the longer one. The conservative rule is the defensible rule — the number you carry into a renewal should be the one nobody can shorten.
- Read-only consumers: 92 users who log in and write nothing. The usual advice is to evaluate them for a cheaper license type. The stronger move is to stop giving them a CRM seat at all and serve them through the corporate BI tools the estate already runs — a conversation a CIO can actually have, and a bigger lever than a license downgrade.
- Non-business activations: 185 accounts — system noise plus integrations that were never people. This is the single most defensible number on the page, because it is simply the measured difference between the two bottom levels of the funnel: accounts with recorded operations, none of which touched a business object. There is nothing in it to argue with.
Four rungs, four different decisions, 971 seats — 34% of provisioned, and not one of them is a deletion list. The cascade also resolves into six user cohorts carrying the same actions: never logged in → remove; inactive → review against the engagement history; read-only → serve through corporate BI; active standard → confirm the process they work in deserves them; active power → invest, this is where training pays back; API / integration → migrate to integration licensing. Stood Flows qualifies the cohorts; it never deactivates anyone.
Visits: what the read-only population actually does
The DML view can only report what a user wrote, and for a population that writes nothing that is a measurement of almost zero. Ninety-two people log in regularly and produce no business DML — and the rung above proposes doing something consequential about them, so “they write nothing” is not a strong enough basis on its own. Visits reconstructs the other half of the behaviour: the screens they open, the navigation paths they take, how long their sessions last and how often they come back, filterable by the DML category each user already falls into.
That turns the read-only rung from a suspicion into a description. A user who logs in daily, opens three dashboards and leaves is a reporting consumer, and the case for serving them through the corporate BI tools rather than a CRM seat is now evidence rather than assertion. A user who logs in weekly and walks the full case console is doing real work that happens not to write — a very different conversation, and one where a licence downgrade would break something.
It configures itself to the org. Visits first measures which UI event types your org actually emits and what share of the population each one can see, then uses only the ones with real coverage. Classic, Lightning and portal-heavy orgs all work without setup, and the coverage it measured is printed on every view — so a thin org reads as thin rather than as a confident number built on a fifth of the users.
The privacy boundary is part of the design, not a setting. Visits stores aggregates only: no record ids, no URLs, no IP addresses. It answers which screens a population uses and how often, and it is deliberately incapable of answering what any individual looked at, which is the question a works council will ask first. It runs on Enterprise, where the event-log analysis lives.
Engagement over time, not a snapshot
A single window can mislead, so Stood Flows caches as much engagement history as the org’s own event-log retention allows — up to 23 months in the demonstration estate. Monthly stacked bars sort connected users into tiers — daily, weekly, monthly, infrequent — each computed on a trailing 28/30-day window, drilling from bucket to license type to profile. Login seasonality plots active-user-days per month with the current year overlaid on the previous one: if March is always quiet, the overlay shows it, and a quiet March stops looking like decline.
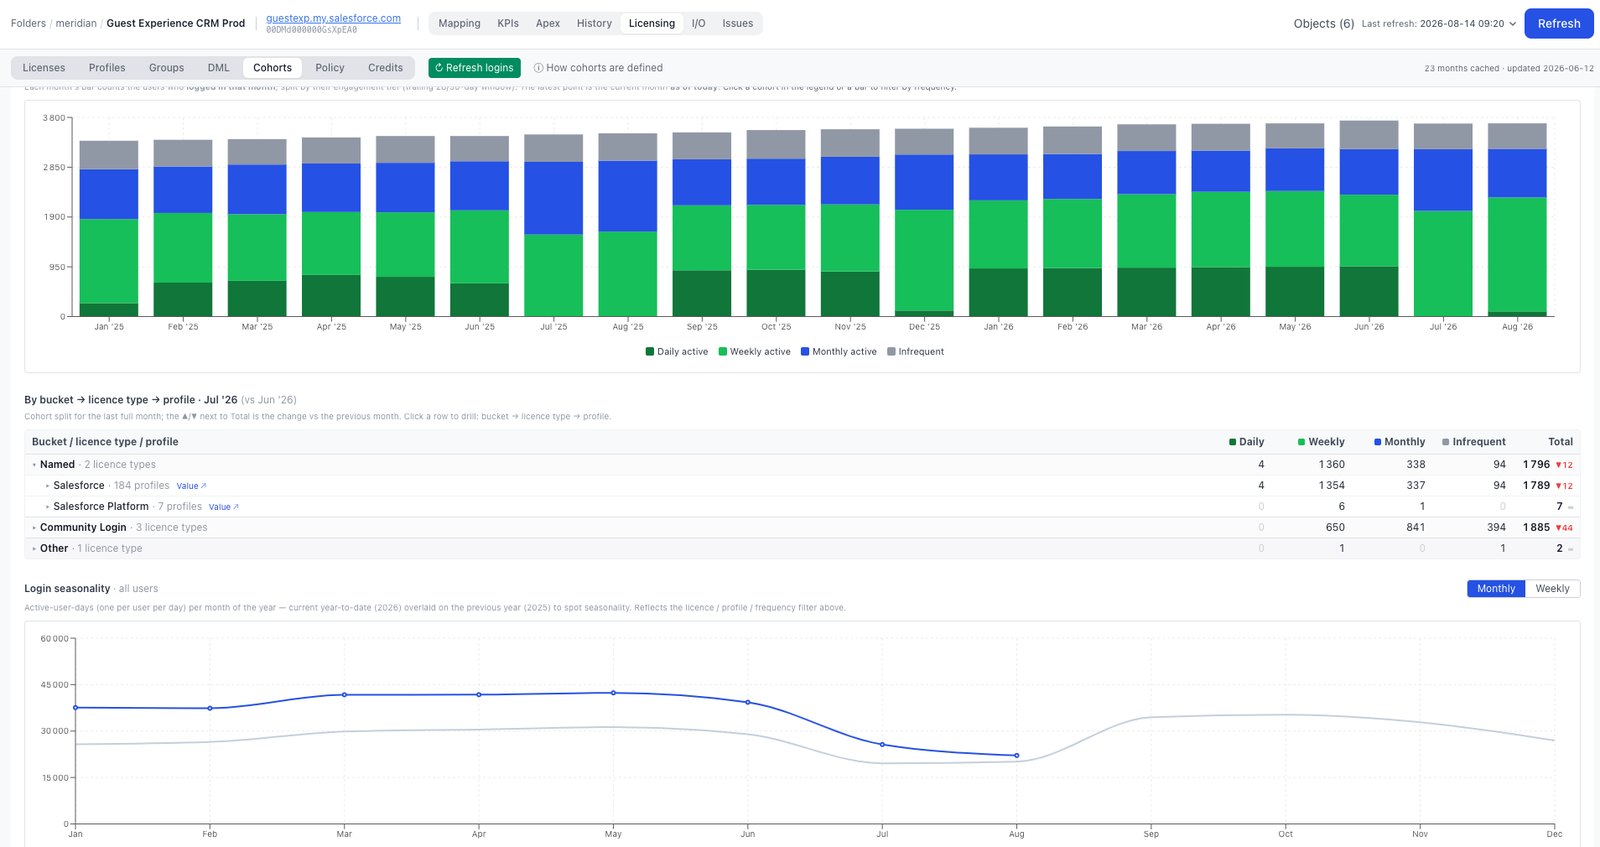
10 of 20 months shown · engagement tiers per user, trailing window · illustrative.
A DML analysis over a two-week window measures those two weeks, nothing more. A quarterly billing run, a seasonal team, an auditor who works one month a year will all read as silent. So the cascade window sits alongside the cached engagement tiers, and “no usage in period” is a distinct state from zero throughout Stood Flows. Before a seat is reclaimed, the window says “inactive now” and the history says whether “now” is representative.
The deactivation policy is a simulation
Buffer and releasable are two different things, and the page keeps them apart. The buffer is entitlement you hold and have not assigned — 335 seats in the flagship org. Releasable is the qualified rungs above it, which sit on assigned seats and belong to different owners. Merging them into one number hides both the remedy and the risk. What follows is about the buffer.
The buffer is not waste queued for deletion — it is a negotiating position. At renewal, unused entitlement is the only lever a customer holds: a buffer of zero at the end of the term means no credible case to reduce the next commitment. You cannot argue down a number you are fully consuming. Too much is money standing still; too little is leverage given away — the goal is a deliberate buffer, sized and timed against the contract cycle. Per-org measurement is the precondition: the portfolio buffer is 18%, but Events & Catering Sales holds 56% — money standing still, one business unit paying for an org nobody adopted — while the flagship Guest Experience org holds 12%, thin going into a renewal. Same estate, opposite problems, neither visible from the average.
To size the position, Stood Flows simulates a deactivation policy: for each org, a no-login threshold (90 days, say) and a list of exempt profiles — integration users, executives, auditors. The simulation counts every named-license user past that org’s threshold, excludes the exemptions, adds the existing buffer, and states the seats that could be released per org, against each org’s own rule and last licensing refresh.
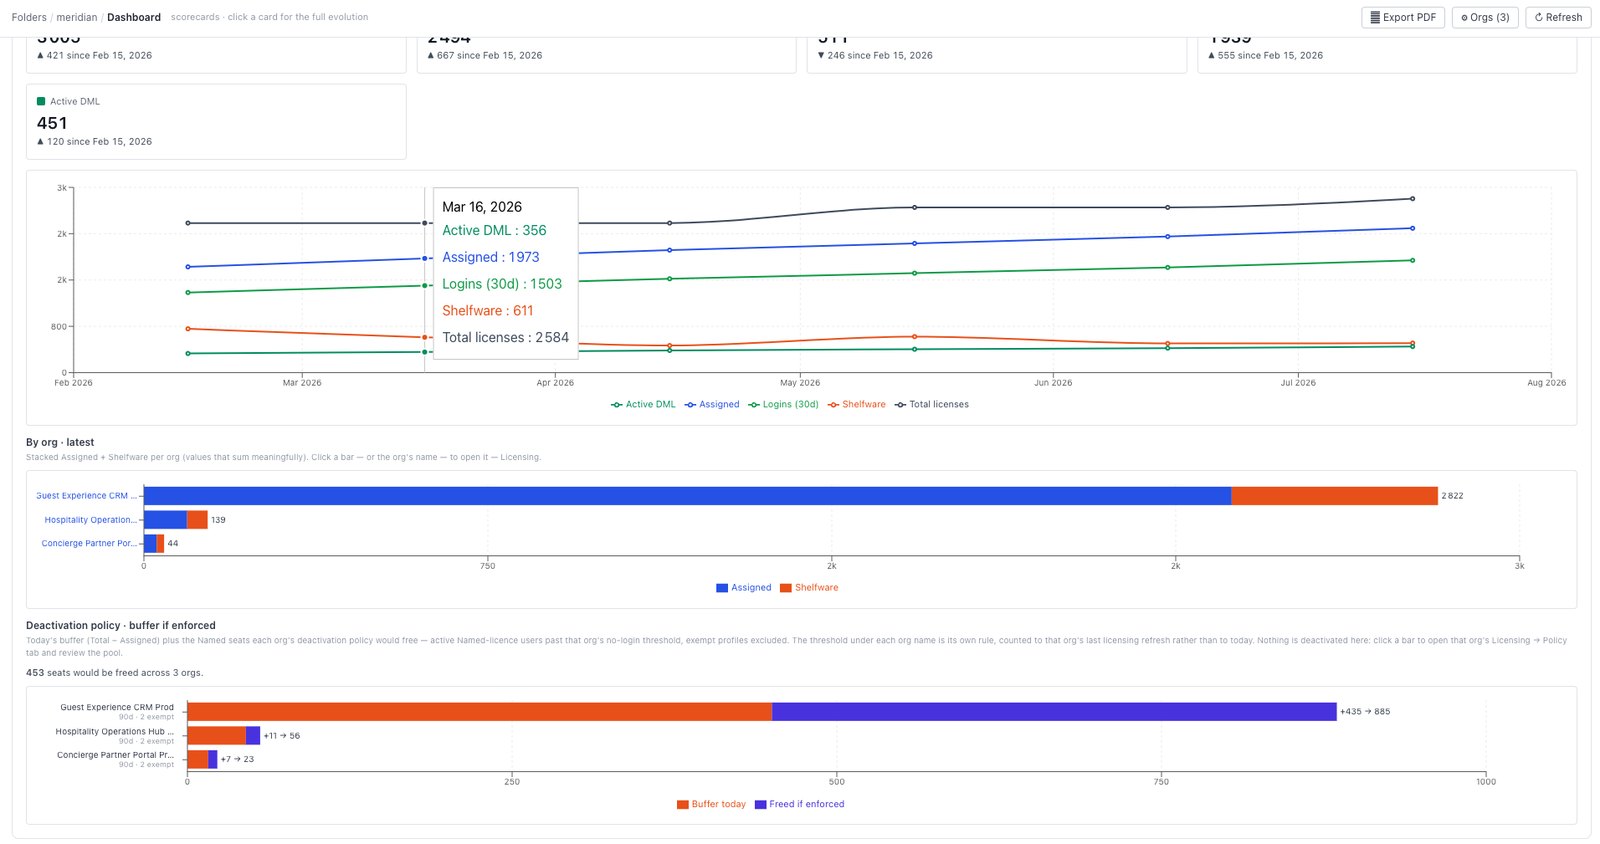
To be explicit, because it matters: nothing is ever deactivated by Stood Flows — it is read-only (the architecture), and the simulation releases nothing. It gives you the number and the named users behind it; enforcement is a decision you take through your own change process. What you bring to the renewal is a position held knowingly: this is what the buffer becomes if we enforce the rule we already agreed, and this is the volume we are prepared to commit to next.
SELA reconciliation, line by line
The contract view holds the SELA (Salesforce Enterprise License Agreement) itself: total value, term, order form and agreement number, then every line. The demonstration contract runs 1 February 2025 to 31 January 2030 at a catalogue value of $6.57M per year, capped at $4.21M per year, across 102 SKU lines — 75 unit lines, 9 percentage add-ons, 18 usage lines — mapped across 9 orgs — and never forget the lines that do not represent your core org estate: a legacy org, a Marketing Cloud MID, a Data Cloud tenant, a Heroku account. Four of the nine are outside what Stood analyses, and knowing which four is a finding you should be making before anyone reconciles a line: the gap between what the contract covers and what you can analyse with Stood is itself the first result.
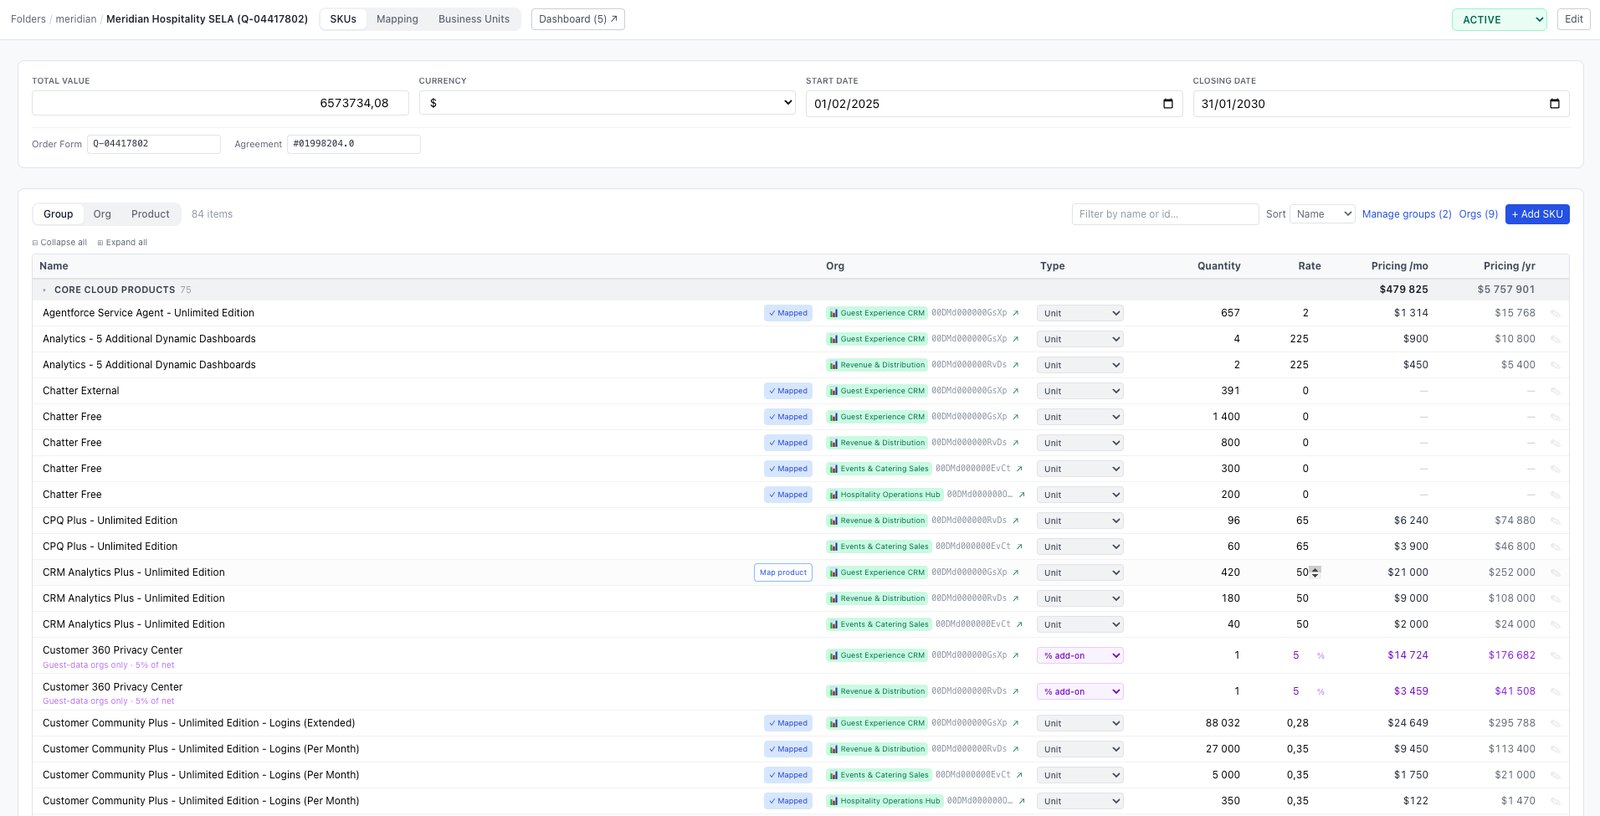
Each SKU line shows its type — a unit line (quantity × rate, such as CRM Analytics Plus at 420 × $50, $252,000/yr) or a percentage add-on (Customer 360 Privacy Center at 5% of net, $176,682/yr) — its monthly and yearly pricing, and an org chip naming which org consumes it. Lines group by product family, with the core cloud products group alone at $5,757,901/yr.
| SKU | Status | Org | Qty | Rate | /yr |
|---|---|---|---|---|---|
| Customer Community Plus — Logins | ✓ mapped | Guest Experience | 88,032 | 0.28 | $295,788 |
| CRM Analytics Plus — Unlimited | ✓ mapped | Guest Experience | 420 | 50 | $252,000 |
| Customer 360 Privacy Center · 5% of net | ✓ mapped | Guest Experience | 1 | 5% | $176,682 |
| CPQ Plus — Unlimited | ✓ mapped | Revenue & Distribution | 96 | 65 | $74,880 |
4 of 102 lines shown · unit and % add-on pricing, each line mapped to the org that consumes it · illustrative.
Every line is either mapped to an org or flagged unmapped. An unmapped line is a question with a dollar figure attached: who consumes this, and would anyone notice if it left the next order form? Mapping is where contract meets org — a seat line stops being a row on an invoice and becomes seats in a specific org whose actual usage the cascade above can measure. Business units then cut the same contract by internal ownership rather than by Salesforce’s line ordering: credited allocation per unit is set against actual draw, and the gap between the two is what the view exists to show.
Consumption credits, set against the contract
Seats are no longer the whole bill. The Credits tab measures Data 360 and Agentforce token consumption against the processes that actually add value, and sets consumption lines against what the contract provides — so you see burn rate against entitlement rather than finding out at true-up, and you see which business processes the tokens are actually spent on. A logins-based community line (88,032 logins at $0.28, $295,788/yr in the demonstration contract) is exactly the kind of line that goes unexamined for a full term.
Structural complexity is not an abstract quality problem: it is maintained by people on seats that appear on lines in a contract with a date on it. Stood Flows puts usage, structure and contract in one place — and every number can be audited back to your own org. Remove the bloat and the contract line shrinks with it: the saving is the consequence; the simpler CRM is the point.
Next in the arc: Govern — the portfolio, the baselines, the practice →
All figures on this page are illustrative, drawn from a synthetic demonstration estate — not customer results or benchmarks.