Stood Flows is the tooled method behind one purpose: make CRM simpler by removing bloat, with insights sharp enough to act on. It measures every business process in a Salesforce estate — the structure it carries, who actually uses it, and its share of the contract — so dead processes, an unmanaged license buffer and unjustified complexity stop being suspicions and become lines on a worklist. In the demonstration estate used across this site — five synthetic orgs — Stood Flows resolves the portfolio into 254 business processes, finds 126 with no activity in the period and 47 holding no records at all, and sets 3,512 assigned seats against 4,285 provisioned under the contract. Illustrative figures, not customer results; the point is that every one of them has a denominator you can inspect. How it runs — on your machine, read-only — is covered below, and the full security architecture is on the security page.
The unit of measurement
Stood Flows measures the business process — one object combined with one record type. Not the org in aggregate, not the metadata component. A business process has an owner and a budget, so a finding attached to it becomes a decision someone can take; the full argument for the unit, and the published method built on it, is on the methodology page.
Analysis centres on the objects your business actually runs on — Lead, Opportunity, Case, Campaign, Account and Contact — plus any custom object carrying a stage or status field. That last clause matters in an enterprise org: custom objects account for a meaningful share of the demonstration portfolio’s 254 business processes.
Folders, graphs, orgs
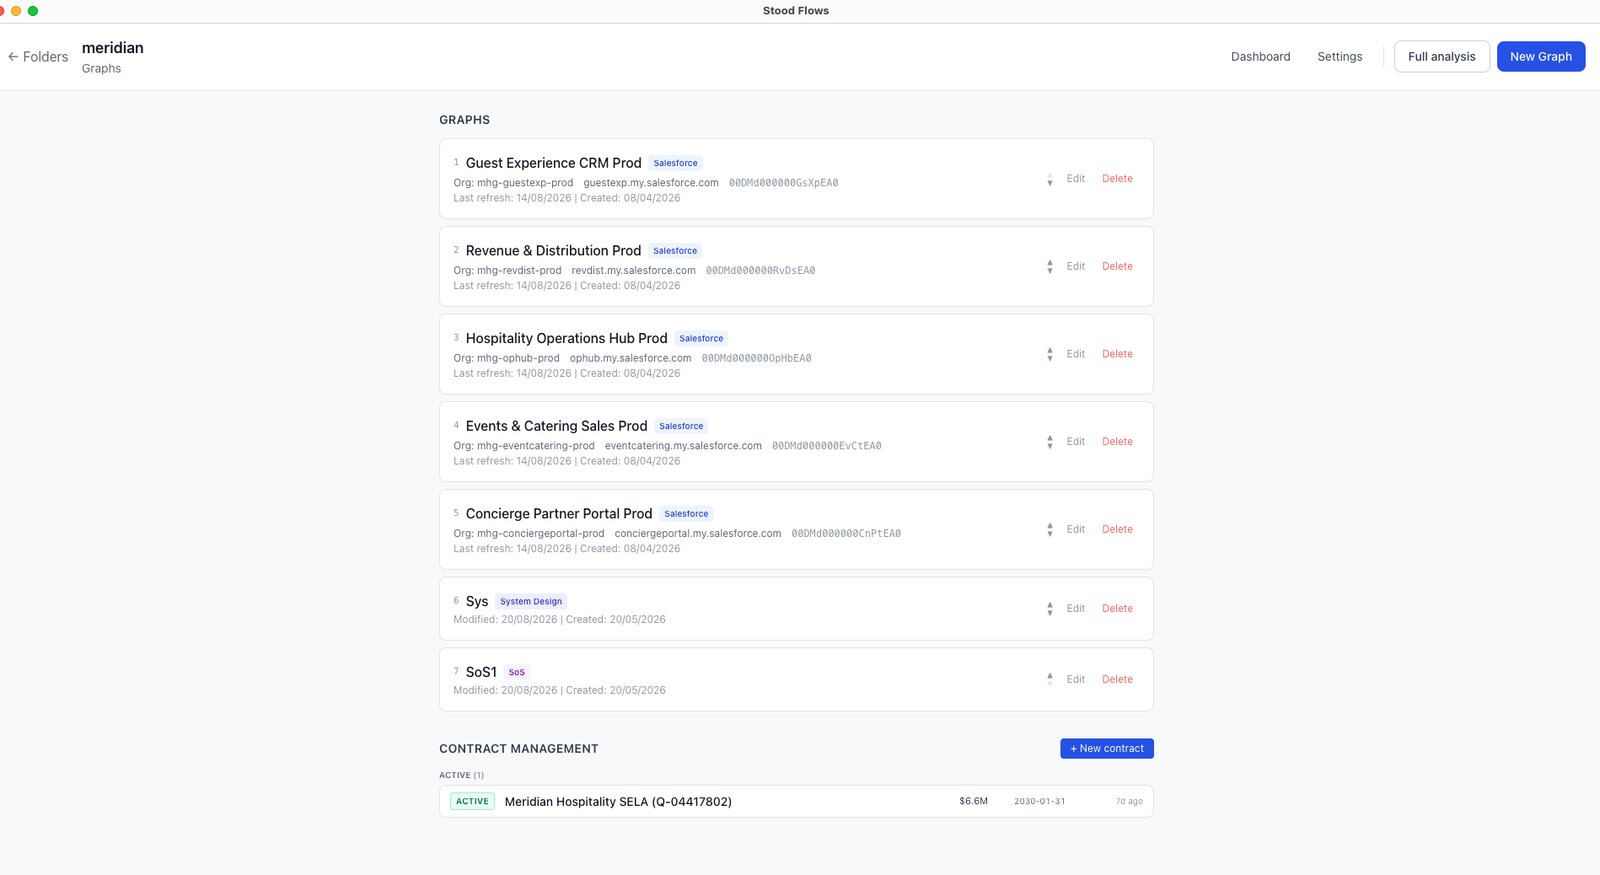
Every governance question spans orgs, so the working structure does too. The unit of work is a folder: one folder per estate, holding one graph per org, plus System Design and system-of-systems (SoS) graphs for architecture work. The folder level carries what spans orgs — a multi-org Dashboard of portfolio scorecards with deltas against a chosen baseline, and Contract Management, where a SELA (Salesforce Enterprise License Agreement) is broken into SKUs and mapped line by line to the orgs that consume them.
Each Salesforce graph opens into eight views:
- Mapping — business processes as swimlanes: stages in sequence, each stage carrying its
active/totalrecord count, with triggered flows attached to the stage they fire on and validation rules grouped beside them. - KPIs — the analytical table: one row per business process, with volume, ghost records, activation over a date range, lifecycle timing, related objects, and the complexity score with its seven inputs shown as raw counts.
- Apex — trigger-rooted class dependency trees, backbone or org-wide, with DML, SOQL and record-type-condition tags down to the source line.
- Flows — every active flow in the org, scored by step count and clustered by the object that triggers it, backbone or org-wide, with runtime and error counts from event log files and Process Builder listed separately.
- History — every element in the org by creation month, 2017 to today, stacked by type.
- Licensing — the named-license funnel from provisioned (SELA) through assigned, logged-in and active-DML users; DML by license, object and package; Visits, the screens and navigation paths the population actually opens; monthly activity cohorts; a deactivation-policy simulation.
- I/O — inbound and outbound call volume from event log files.
- Issues — raised by an analyst or an agentic co-worker from the insights the analysis surfaces, tracked open or resolved.
The per-org header states the alias, my-domain URL, org ID and last refresh time, so every number on screen is traceable to a fetch you ran.
How it runs
Everything below happens on the analyst’s machine: Stood Flows is a signed desktop application for Mac and Windows that connects to your orgs through the Salesforce CLI you already trust, and reads — it never writes. There is no Stood cloud: the analysis is local by default, and team sharing, when you enable it, runs on your own GitHub or S3 with Admin and Contributor roles (the full architecture).
Scan fetches the org through the CLI and assembles the graph: objects and their business processes, automation and logic, the presentation layer, access and licensing, and the event stream that supplies the DML and I/O analysis — the full fetch tree is published in the documentation. A first scan typically takes a couple of minutes; heavy orgs run longer in the background, and metadata and usage run as separate analyses, so you see structure before the volume-heavy passes finish. When the first scan lands, the Mapping view shows the org’s business processes as swimlanes with per-stage active/total counts — the first honest picture of which processes are real. Everything lands in local files you can diff, archive or delete; most teams refresh monthly, and browsing is instant between refreshes.
Analyze is where the views earn their keep. Nothing is a black-box grade: the published methodology shows the arithmetic, and the raw counts sit beside every score. Red zones are your analysts’ call, not a threshold — an analyst raises an issue by right-clicking a row in the KPI table, and an agentic co-worker can be plugged in locally to massify that analysis (not included).
Transform is deliberately the customer’s step. Stood Flows surfaces and qualifies — cold classes, the buffer per org, a simulated deactivation policy, the issues your analysts raised — and your team, or your integration partner, acts on the org. The tool never writes to Salesforce and never remediates automatically.
Each refresh is a versioned snapshot; run monthly, and every number reports its delta against the baseline you choose.
One arc, three pages
The analysis follows one arc, and each leg has its own page, in the order the work runs:
- Analyse metadata — which processes still live at all: volumes, ghosts and stage balance; the structure behind them and its complexity score; the related objects, the Apex dependency trees and cold classes, and the I/O volumes underneath.
- Usage & costs — real usage read from DML in event log files, not logins; activity cohorts; the license cascade from the contract down; the deactivation simulation; the SELA reconciled line by line; consumption credits.
- Diagnostics — the named insights the first two legs produce, each with a detection method, a remedy and a test for whether it is worth doing.
- Govern — the portfolio scorecards, versioned snapshots and baselines, the issue backlog, and the continuous monthly practice that bends the tech-debt curve.
The demonstration estate
Figures throughout this site come from one five-org demonstration estate. Portfolio-level figures (254 business processes, 4,285 provisioned seats) describe all five orgs together; flagship-org figures (the Apex estate, the two-week DML window) describe its largest org alone, and each page says which is which. The customers page walks that estate end to end.
Judge it on your own org
The fastest way to judge Stood Flows is to see it run — a demo walks the analysis through on the demonstration estate — and the fastest way to believe it is to run it on an org you own — a Quickstart shows what the analysis surfaces in a couple of hours, and the first scoped project that follows runs it on your own orgs.
Next in the arc: Analyse — processes, structure, code and data →
All figures on this page are illustrative, drawn from a synthetic demonstration estate — not customer results or benchmarks.