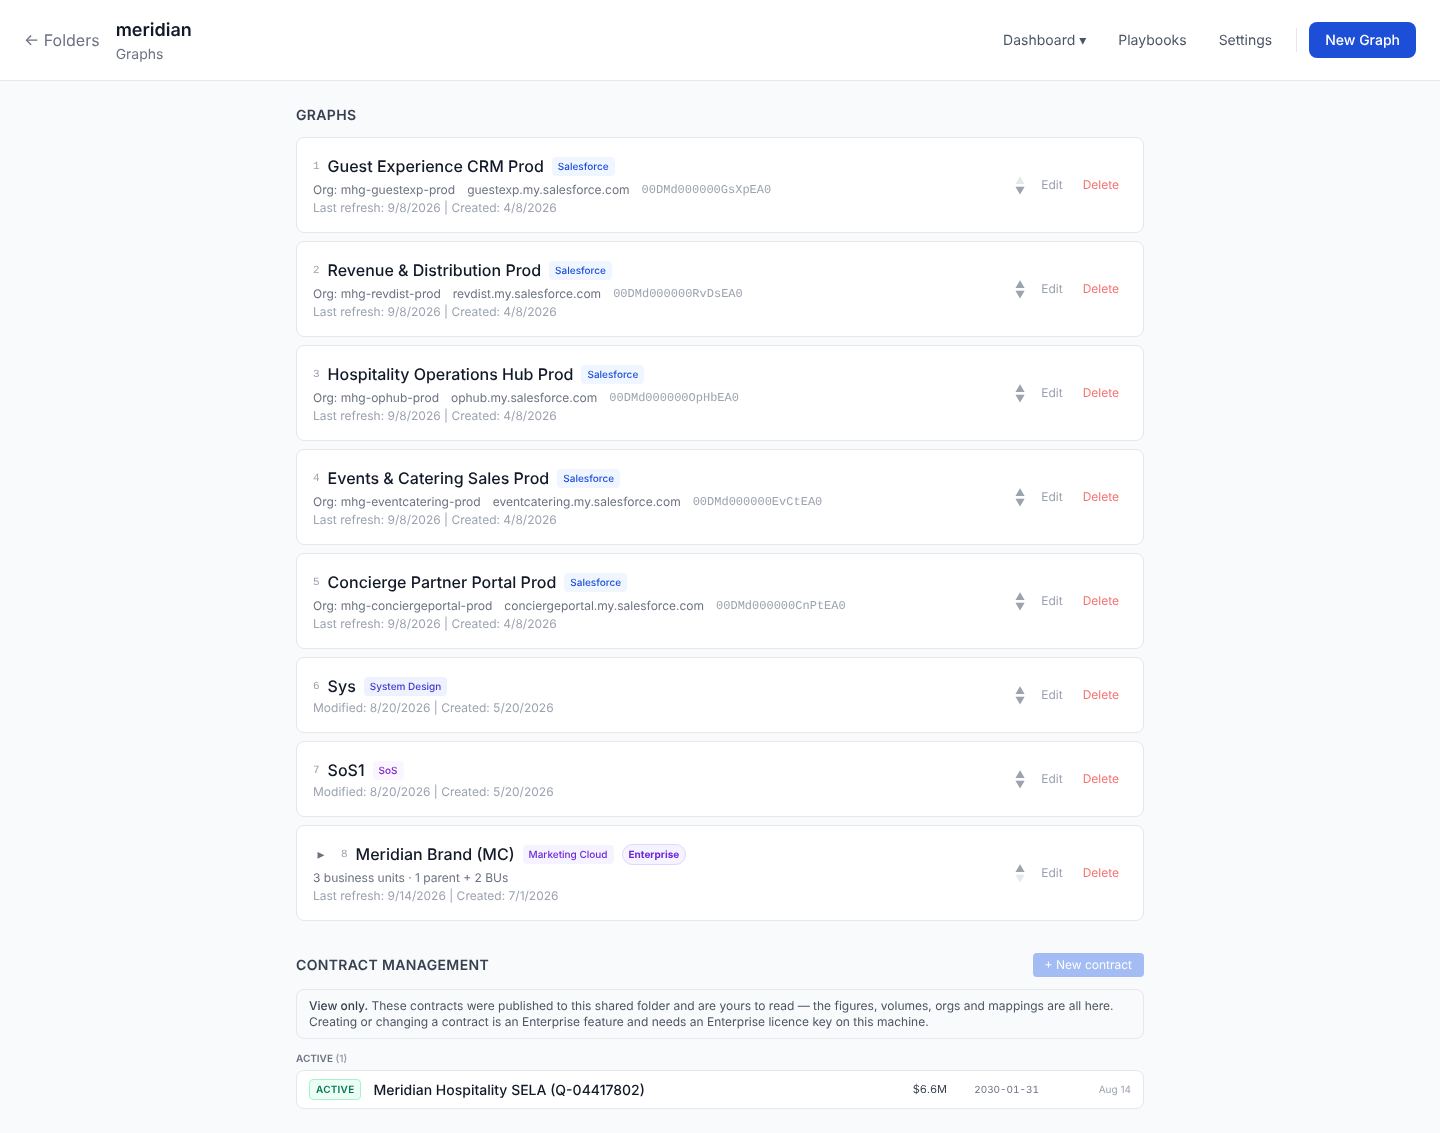
This is the shortest path from “I just installed Stood Flows” to “I have a graph I can explore”.
1. Install and launch
Download the current installer from the link that came with your licence — DMG for macOS, MSI/EXE for Windows. Open it and install like any other desktop app; no toolchain or compile step is involved.
On first launch the app creates ~/StoodFlows/ for everything it needs — config, workspaces, caches.
The window opens on the Folder list. Empty on a fresh install.
2. Confirm the Salesforce CLI is reachable
Click the gear icon (top-right) → Global Settings. You’ll see:
- sf CLI: green dot + a version number → you’re good. Red → install or browse to the binary (see Prerequisites).
- gh CLI: optional; only needed if you want GitHub-backed issues.
If sf is green, every subsequent step works. Close Settings.
3. Create a folder
A “folder” is the local container for one Salesforce org. From the Folder list, click New folder. You’ll be asked for:
- Folder alias — short identifier, used as the directory name under
~/StoodFlows/workspaces/. Lowercase, no spaces (e.g.meridian,acme-prod). - Salesforce org alias — must match a
sfalias you’ve already authenticated withsf org login web. The dropdown shows whatsf org listreturns.
The folder is created on disk, you land on the empty Graph list.
4. Enter your licence key
If this is a licensed folder, drop the key file into ~/StoodFlows/workspaces/<alias>/license.key or paste it from Global Settings → Licence. See License keys. Without a valid key, Refresh is disabled.
5. Create a graph
Click New graph in the folder. A graph is an analysis project — usually one per release cadence (a “Q3 audit” graph, a “post-migration baseline” graph). Give it a name, pick the source:
- Salesforce — the normal mode. Pulls metadata from the connected org.
- System of systems — manual diagramming, no org reads (covered elsewhere).
- System design — manual diagramming, no org reads.
For a Salesforce graph, the six standard CRM objects (Lead, Opportunity, Case, Account, Contact, Campaign) are pre-seeded as enabled. You can disable any of them later from the object panel.
6. Refresh the backbone
Click Refresh in the toolbar. A confirmation popover asks whether to Keep analyses — keep this on for the first refresh; it carries forward any complexity, Apex, usage, lifecycle, custom-object, and layout analyses if a previous version had them, so you don’t lose work between refreshes.
A backbone refresh deliberately fetches only the structural skeleton of the org:
- Picklist statuses / stages for Lead, Opportunity, Case, Campaign.
- Business processes (the picklist-based process definitions on those four objects), including the stage order.
- Record types for every enabled object, plus per-record-type record counts at each stage (via
/services/data/limits/recordCountfor master totals and SOQLCOUNT(Id) GROUP BYslices for per-stage volumes, with a 10 000 cap on per-RT counts).
It then writes a new version snapshot to workspaces/<alias>/graphs/<slug>/versions/v<N>.json and updates latest.json.
That’s it — Refresh does not fetch profiles, layouts, Lightning pages, validation rules, assignment rules, record-triggered flows, Apex triggers, or any code. Those come from the Launch X analysis dropdowns inside each KPI column-group header (Complexity, Objects, Apex, Usage). Splitting them out keeps the refresh fast on big orgs — a backbone refresh is typically 30 seconds to a couple of minutes; the heavier analyses can take much longer and you may not need all of them on every refresh.
A progress panel streams what the refresh is doing. See Methodology for what counts as backbone and how the second-phase analyses layer on top.
7. Explore
When the refresh completes you’re in the main editor:
- Mapping: the business process map — each object’s processes as swimlanes, with stages and the triggered flows attached where they fire.
- KPIs: the master table, one row per (object × record type × business process). Volume, Usage, Lifecycle, Fields, Objects and Complexity column groups toggle from the buttons above the table. See the KPI table.
- Apex: triggers and their dependency chains, cold classes, packages.
- Flows view: every active flow scored by steps, with what actually ran.
- History: when each element was created or last modified.
- Licensing: eight sub-tabs — Licenses, Profiles, Groups, DML, Visits, Cohorts, Policy, Credits.
- I/O: inbound API callers and outbound callouts (needs an “Analyze I/O” run).
- Issues: anchored issues grouped by epic, GitHub-, CSV- or S3-backed.
Above the graph list, the folder itself has a Dashboard (every org side by side, with an Objects explorer) and Settings (sharing, roles, Marketing Cloud).
8. Versions
Every refresh creates a new version. The dropdown next to Last refresh in the header lets you switch between them. Older versions stay on disk under versions/v1.json, v2.json, etc. Use this when you want to compare “before” and “after” a release.
9. Save your work
Nothing to save — everything is persisted automatically. The folder is yours; back up ~/StoodFlows/workspaces/<alias>/ with the rest of your project files if it matters.
Where to go next
- The methodology — why backbone-first and how the layers stack.
- KPI table — read every column.
- Apex packaging — generate a migration handoff for an Apex chain.