Stood Flows · diagnostics
Nine shapes a row can take, and what each one means
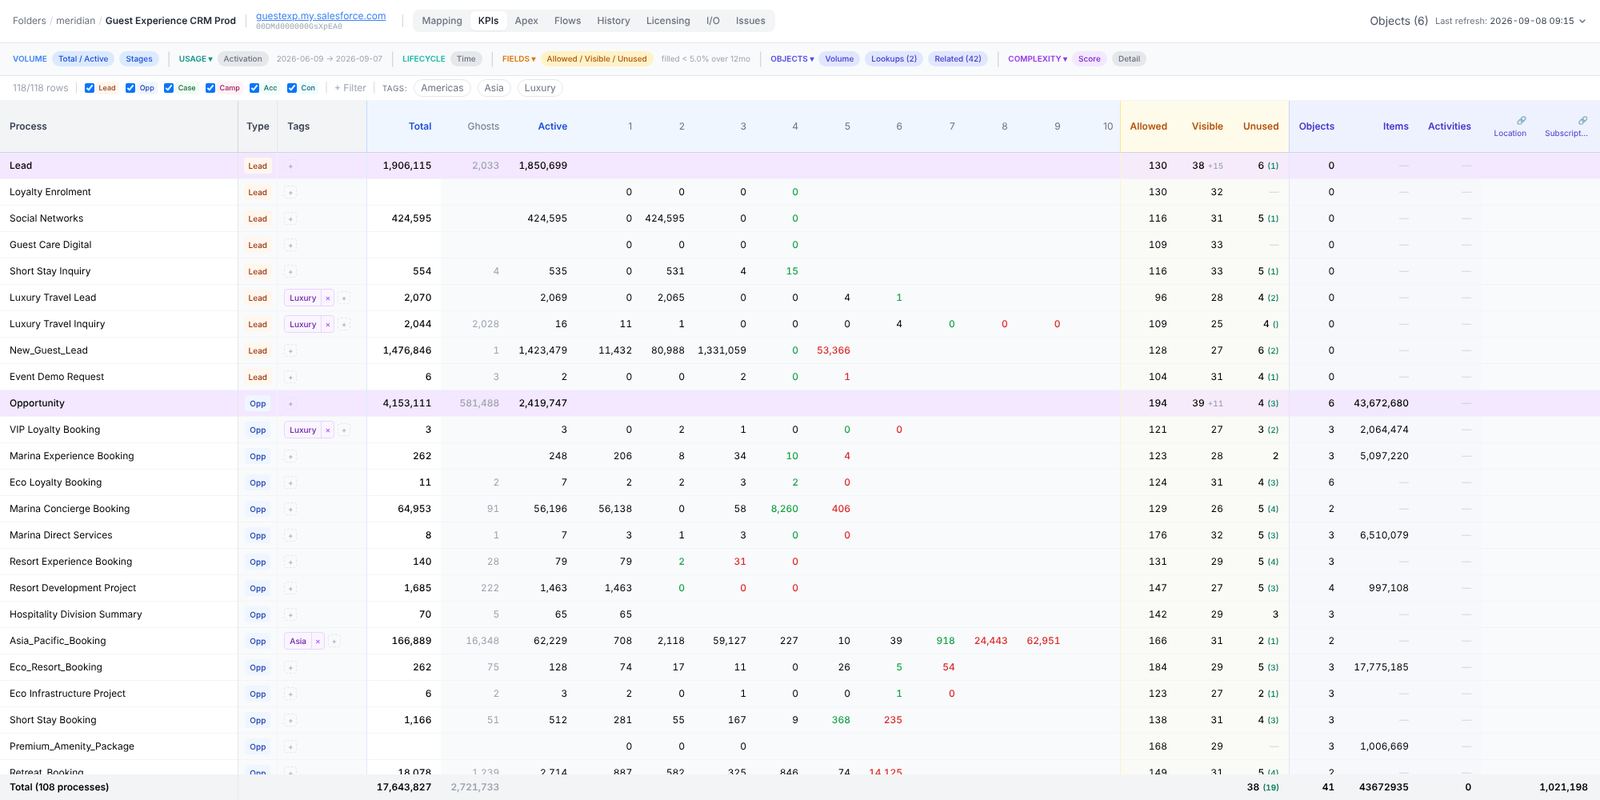
The matrix does not flag rows red. It lays out counts in a fixed order so that a shape is recognisable at a glance. These are the shapes we see in every large estate, with the epic each one files to.
| Process | Total | Ghosts | Active | 1 | 2 | 3 | 4 | 5 | Modified | Actors | Score | Stages | Profiles | Layouts | Triggered flows | Rules |
|---|---|---|---|---|---|---|---|---|---|---|---|---|---|---|---|---|
| Heritage Conversion | 0 | 0 | 0 | 0 | 0 | 0 | 0 | 0 | 0 | 0 | 64 | 9 | 40 | 12 | 1 | 2 |
| Yacht Charter Interest | 124 | 3 | 96 | 71 | 18 | 7 | 25 | 0 | 9 | 2 | 31 | 5 | 14 | 6 | 3 | 3 |
| Spa Enthusiast | 88,402 | 1,110 | 61,220 | 40,118 | 21,102 | 0 | 26,072 | 0 | 0 | 0 | 26 | 4 | 8 | 4 | 4 | 6 |
| Loyalty Enrolment | 1,420,118 | 2,912 | 1,364,900 | 22,804 | 1,342,096 | 0 | 52,306 | 0 | 31,440 | 118 | 28 | 4 | 9 | 4 | 5 | 6 |
| Website Booking Intent | 742,310 | 11 | 742,299 | 742,299 | 0 | 0 | 0 | 0 | 60,120 | 3 | 17 | 4 | 5 | 2 | 4 | 2 |
| Luxury Travel Inquiry | 2,044 | 2,028 | 16 | 9 | 4 | 3 | 0 | 0 | 2,044 | 1 | 17 | 9 | 5 | 3 | 0 | 0 |
| Opportunity | 4,153,111 | 581,488 | 2,419,747 | … | … | … | … | … | 311,207 | 1,214 | 149 | 87 | 55 | 42 | 1 | 16 |
| Holding Company | 312 | — | — | — | — | — | — | — | 14 | 3 | 131 | — | 115 | 9 | 2 | 5 |
| Signature Recovery | 14 | 0 | 11 | 6 | 2 | 3 | 3 | 0 | 2 | 1 | 58 | 5 | 2 | 1 | 24 | 26 |
Zero-record process. Total 0 with a score of 64: nine stages, 40 profiles that can see it, 12 layouts, a flow and two rules, all maintained for nothing. The tell is the pair Total = 0, Score high. Files to Remove zero-record processes.
Low-volume process. 124 records in a year, two actors. A real configuration with almost no use: pilot programmes, demo data, a product line that never launched. Threshold is 1,000 records; the epic is deliberately named qualify because the owner decides, not the tool. Files to Qualify low-volume processes.
Inactive process. 88,402 records, and nothing modified or created in twelve months by anyone. The volume is history; the usage columns are the present. Modified, Created, Modifiers, Creators, Actors all 0 is the strongest signal a record type can be retired. Files to Remove inactive processes.
Stage concentration. 1,342,096 of 1,420,118 records rest in stage 2, Nurturing, which is not final. Either the stage is where the business actually ends, or an automation parks records there. Read the Time column next: a long dwell confirms a parking lot. Files to Qualify stage concentration.
No final stage ever reached. Every one of 742,299 active records sits in stage 1 and the final columns read 0. A process where nothing ever closes is a form, not a lifecycle: a sync writes the record and nobody works it. Files to Fix process stage configuration.
Ghosts dominate. 2,028 of 2,044 records carry a status this record type's process does not offer. A connector writes "Closed - Converted" straight into the field, bypassing the process. Hover Ghosts in the app for the off-process / retired / unattributed split. Files to Clear ghost records.
Oversized picklist. The master row shows the picklist: 87 Opportunity stage values, while the widest business process uses 17. The other 70 values are history that every report filter, validation rule and integration mapping still has to carry. Files to Trim oversized picklists.
Over-broad visibility. High Profiles, low everything else: 115 profiles can see an Account record type that 3 people touch. Not an automation problem, a sharing problem, and the reason licence allocation per process looks wrong. The fix is in profiles and permission sets, which Stood Flows lists per row.
Fragile back-office cell. 14 records, two profiles, 24 flows and 26 validation rules. The automation is where the complexity lives, and the two people who understand it are the single point of failure. The Score detail opens each flow and rule so the retirement can be scoped. Candidate for Fix process stage configuration.
Beyond the backbone row
Three further shapes live in other panels but file into the same backlog.
Automation that is not process-specific
Triggered flows with no record-type filter land on the master row. A master row with 43 flows under three record types means every process pays for every other's automation. The Flows view adds the runtime: live, never ran, erroring above 1%, Process Builder leftovers.
Starving children, sprawling parents
A related custom object at under 1% of its parent's volume, or idle for twelve months, is starving. Twenty-one custom objects hanging off one Account record type is sprawl. Both extremes show in the per-object columns of the row.
Seats that never act
Per profile: users, logins in 30 days, actors, and the three cost columns Unlogged + Actor $ + Non-actor $ that sum to Assigned. Click through from a profile to the processes it can see.
Criticality is set by the number, not by opinion
When an issue is auto-filed from a row, its criticality follows the volume it states: high at 100,000 records and above, medium from 1,000, low under that. Errors are at least medium. A tag of urgent-qualification forces high. The thresholds behind the shapes (12 months idle, 1% related ratio, 5% field fill, 1,000-record low-volume line) are a folder policy, editable per customer and shown next to every finding.
In the app
Captured from the application itself, built from the current source tree and opened read-only on the Meridian demonstration workspace.