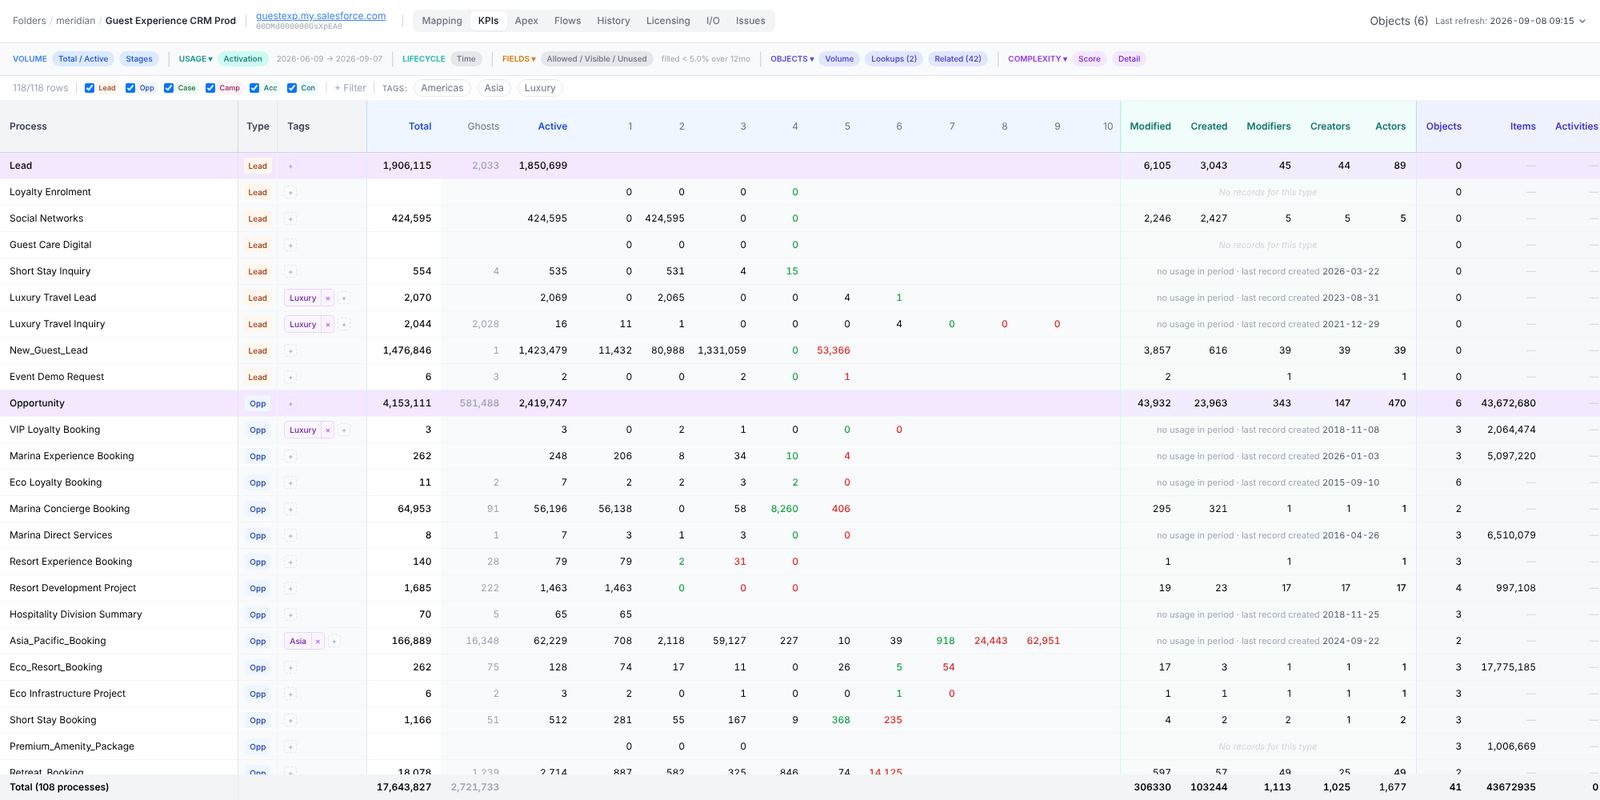
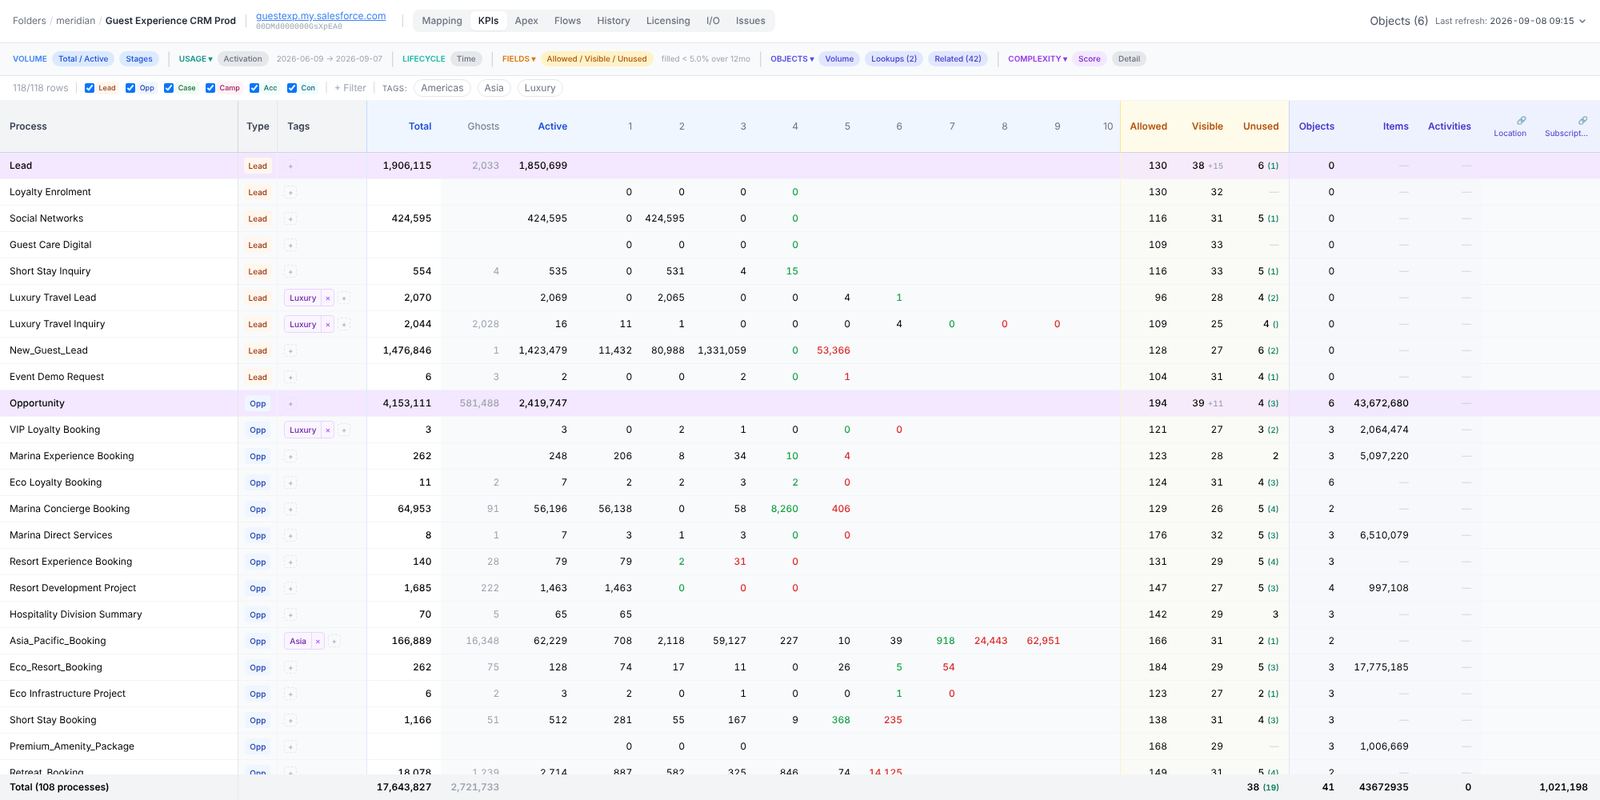
The KPI tab is the master view of a backbone version. One row per (Object, Record Type, Business Process) triple plus a master row per object. Columns are grouped — you toggle whole groups on and off with the buttons above the table.
The intent isn’t to read the whole table in one go. It’s to scan a column group, sort by a heavy column, and drill into the outliers.
The fixed columns
| Column | What it is |
|---|---|
| Process | The record type (or business process) this row is about. Master rows carry the object name. |
| Type | The object, as a colour badge: Lead, Opp, Case, Camp, Acc, Con. |
| Tags | Free-text tags you’ve added. Click the cell to add or remove. Tags survive refreshes and are searchable. |
These never scroll. Everything to the right of Tags is scrollable.
Volume columns (blue)
Toggle group: Volumes.
| Column | What it is |
|---|---|
| Total | Total record count. Master rows: from /services/data/limits/recordCount (exact). RT rows: count from a SOQL SELECT count(Id) FROM <obj> WHERE RecordTypeId = … with a 10 000 cap (displays 10 000+ when the cap is hit). |
| Ghosts | Records the stage columns cannot account for, so that stages + Ghosts = Total always holds. Hover the header for the split: off-process (a status the picklist has but this record type’s process does not offer), retired (a status removed from the picklist after records landed in it), unattributed (blank status, or the residual of a capped count). |
| Active | The sum of the non-final stage columns — records still in play. Which stages count as final is read from the picklist (converted, closed, won) and can be adjusted per object in graph settings. |
| 1 … N | One column per stage the record type’s business process offers, in picklist order: open stages first, then positive finals, then negative finals. Sized to the widest process, never to the master picklist. Counts of rows currently in that stage — the place to spot a funnel where everything rests before the finish. |
If a row has no business process, the s-columns are blank.
See Volumes and complexity for how to use these.
Usage columns (teal)
Toggle group: Usage. Filled by the Analyze Usage button. Reads from the last N days of CreatedDate / LastModifiedDate / CompletedDate on each (object, RT).
| Column | What it is |
|---|---|
| Modified | Count of records last-modified in the analysis window. |
| Created | Count of records created in the window. |
| Modifiers | Distinct users who modified at least one record. |
| Creators | Distinct users who created at least one record. |
| Actors | Distinct users who appear as either modifier or creator (the union). |
These numbers are what feed the Actors column on the Licensing → Profiles tab — see Licensing. Inactive RTs show 0s here, which is the strongest signal that an RT can be retired. When a record type had no activity in the window, the row no longer just shows zeros — it tells you when that type was last used (“last record created …”), or says “No records for this type” when it has never held a record. That makes a long-dormant record type easy to tell apart from one that was simply quiet this period.
Fields columns (amber)
Three columns that answer one question: on this process, which fields is nobody filling in?
- Allowed — how many fields the people working this record type are allowed to see.
- Visible — how many of those actually appear on its page layouts. Only these get judged, because a field nobody is shown is a field nobody can fill.
- Unused — of the visible ones, how many are filled on fewer than 5% of recent records. The figure in brackets is how many of those you could actually delete: your own custom fields. Standard and managed-package fields can only be taken off the layout — that tidies the screen, it doesn’t free anything.
Click Unused or Visible for the field list, each with its exact fill rate, and a slider to move the 5% threshold. Moving it re-reads nothing from Salesforce, so try a few.
On a master row the question is asked field by field: a field is only unused for the object when every record type that shows it leaves it empty. A record type that doesn’t show the field at all has no say either way.
A field we couldn’t measure is never counted as unused. It’s listed separately with the reason — most often that the Stood user hasn’t been given read access to it, which is worth fixing if the columns look thin.
The same menu offers Fields on no layout: custom fields nobody put in front of any user. That one is a softer signal — a field can still be written by an integration or read by a report — so treat it as a place to look rather than a list to act on. It takes seconds and reads no record data.
The analysis is off by default in a full run: tick Field usage, or launch it from the Fields menu above the table.
Custom Objects columns (indigo)
Toggle group: Custom Objects. Visible only when custom objects with volume have been pulled in.
| Column | What it is |
|---|---|
| Objects | Number of related custom objects with non-zero row counts, reachable from this (object, RT) via lookup or master-detail. |
| Items | Total related items for the standard child objects (OpportunityLineItem under Opportunity, CampaignMember under Campaign). |
| One column per CO | Per-custom-object volume in this row’s scope. The header carries 🔗 (lookup-related) or ⇄ (master-detail) and the CO label. |
| Activities | Related activity records (Tasks) for this (object, RT). |
This is where the “long tail of objects” becomes legible: a single Opportunity RT might be the entry point for 30 custom child objects representing line items, attachments, audit logs, etc. You see them all in one row.
A per-CO cell normally shows the exact count. It shows a ”+” instead only when the related object is very large (≈300 000+ rows) and the precise per-record-type count was skipped to keep the refresh fast. Click the ”+” to run Fetch object volumes, which counts it on demand and replaces the ”+” with the real number.
Complexity columns (purple)
Toggle group: Complexity. Filled by the Launch Complexity analysis action — click the + Complexity ▾ header (or Complexity ▾ after the first run, where the menu offers Re-run Complexity analysis). The underlying fetch pulls profiles + record-type visibilities, layouts, FlexiPages (Lightning record pages), record-triggered Flows, Apex triggers, validation rules, and assignment rules. None of those are pulled by a plain Refresh — that keeps backbone refreshes fast.
| Column | What it is |
|---|---|
| Score | The single complexity number for this (object, record type): the sum of every component to the right. It is a count of the things attached to the process, not a weighted formula, so it is easy to justify. Higher = more moving parts, so more expensive and riskier to change. |
| Stages | How many steps the business process has. A longer process is more to configure — and more places a record can stall on its way to done. |
| Profiles | How many user profiles can actually see and work with this record type — i.e. the blast radius of a change. “Visible” means a profile can read records of this record type, whether through a record-type visibility or through object read access (including access granted via a permission set). Only real, in-use profiles count (they must have active users and a page layout). A process 40 profiles can touch is far riskier to change than one only 2 can. Only profiles with a user active in the last 30 days are counted, so dormant profiles don’t inflate the number; the drill-down offers a simulation that lists every profile that can see the record type regardless of recent activity. |
| Layouts | How many distinct page layouts are in play for this record type across those profiles. More layouts means more UI variants that must be kept consistent whenever the process changes. |
| Pages | How many Lightning record pages are configured for this object — each one another place the record’s screen and on-page logic are defined. |
| Flows | How many active record-triggered flows (before- or after-save) fire on this record type — the no-code automation load. Every one runs on each save, so the count is a direct measure of automation weight on the process. |
| Triggers | How many active Apex triggers fire on this object, attributed to this record type from the code. Apex is the hardest automation to change safely — it needs tests and a deployment — so triggers are a strong complexity signal. (See Apex doc.) |
| Rules | Validation rules + assignment rules on the process. Each is a business constraint that has to stay consistent as the process evolves — quiet sources of “why can’t I save this record?” friction. |
Sort by Score descending to find the (object, RT) cells that absorb the most maintenance effort. You’ll typically discover three categories: legitimate big processes, abandoned RTs that haven’t been retired, and one or two cells where complexity grew quietly and nobody noticed.
Every complexity cell is clickable: clicking the Score or any component opens a drill-down that lists the exact contributing items — the specific profiles, flows, triggers, validation rules, and so on — each openable so you can inspect it or raise an issue against it.
Code / Apex columns (moved)
Apex per-object metrics — classes, methods, dependency count and code size — are no longer KPI columns. That analysis now lives in the Apex tab, where you can run it per object or org-wide.
Sorting, filtering, exporting
- Click any column header to sort.
- Right-click any cell for the context menu (Create issue, View in Apex, etc.).
- The Export button on each tab writes a CSV of the current view, including hidden column groups.
- The KPI auto-export — a
latest-kpis.csvnext to the version JSON — is written every time the KPI table re-computes after a Refresh or analysis. That’s the “snapshot of the snapshot” you can hand to an auditor without opening the app.
Master rows vs RT rows
A master row (Object Total) sums its RT rows where the maths makes sense. Total is real (independent count, not the sum, because RT rows are capped at 10k). Modified / Created / Actors are sums. Complexity components are not summed — a profile that’s visible on three RTs counts once at the master level. Unused fields are not summed either: see the Fields section above for how the master row decides.
When master totals look smaller than the sum of RT rows, it’s the 10k cap — drill into the master to see “10 000+” for the capped RTs.