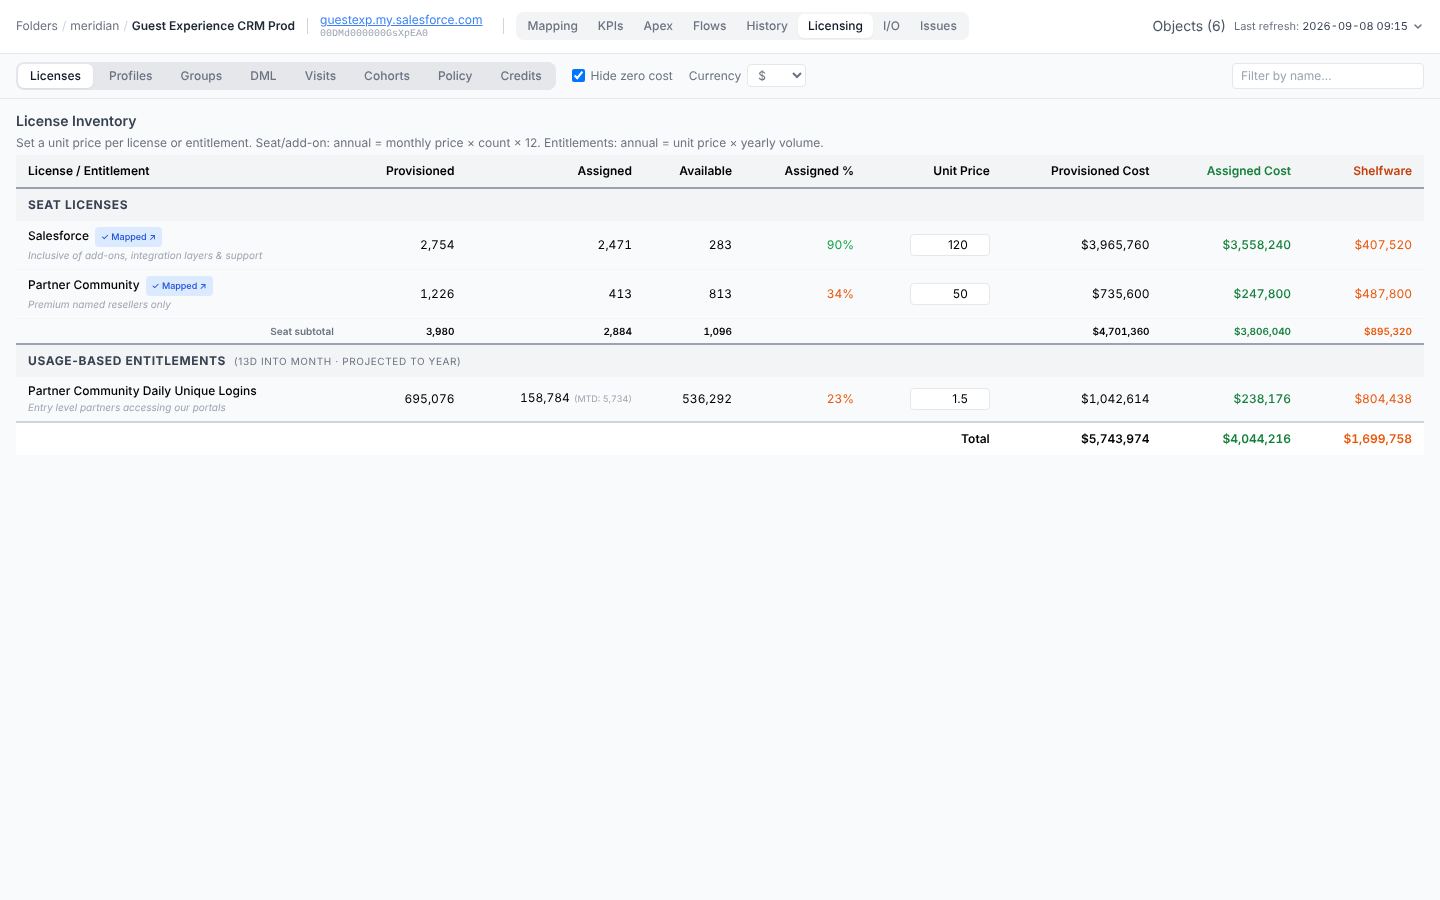
The Licensing tab answers two related questions:
- What are we paying for? — inventory of licences, what’s provisioned vs used, how much it costs.
- Are we actually using what we pay for? — who logs in, who works, who just sits there.
It has eight sub-tabs: Licenses, Profiles, Groups, DML, Visits, Cohorts, Policy and Credits. The DML sub-tab is the bridge to the DML analysis.
The license inventory (Licenses sub-tab)
Each row is one Salesforce licence type (UserLicense + PermissionSetLicense). Columns:
| Column | What it is |
|---|---|
| License | Display name. The yearly-login entitlement (for community-login licences) is shown inline. |
| Provisioned | Total seats available on this licence. |
| Used (%) | Seats actually assigned to a user. The percentage is Used / Provisioned. |
| Available | Provisioned − Used. |
| Unit price | Per-seat per-year cost. Editable in-place — click to enter your contracted price. The default is 0 (we don’t presume to know your contract). |
| Provisioned $ | Provisioned × Unit price. Yearly committed spend. |
| Assigned $ | Used × Unit price. Yearly actual cost based on current assignments. |
Add-on licences (PermissionSetLicense — Einstein, CPQ, Salesforce Mobile, etc.) appear below the core list with the same columns.
Pricing entered here drives every dollar figure in the rest of the panel. There’s no global price list — you tell the app what you pay for what.
Profiles sub-tab
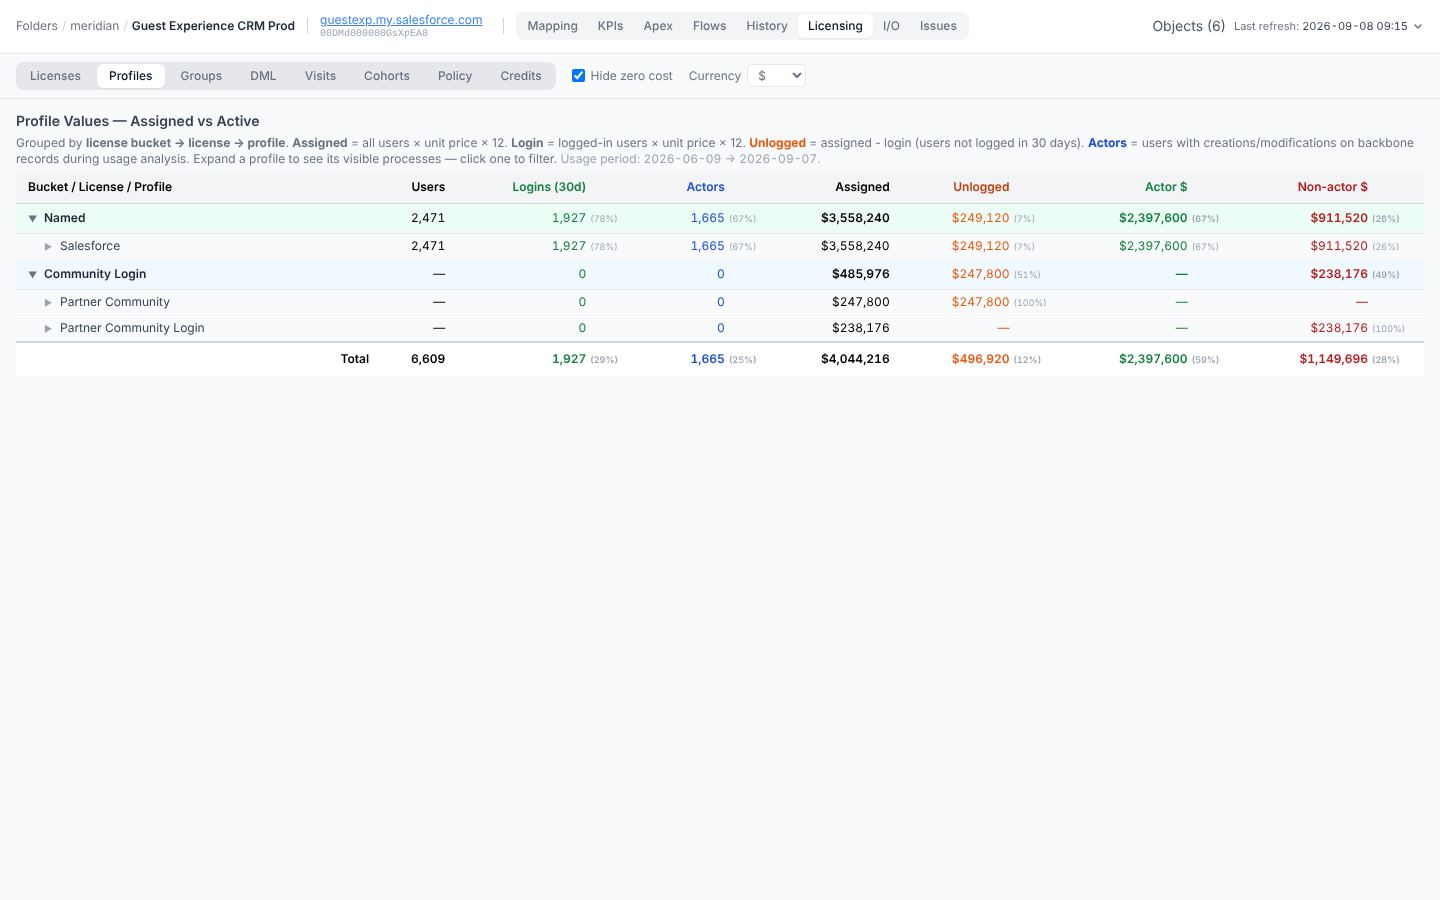
Each row is one profile within a licence. Profiles roll up under their licence; licences roll up under their bucket.
The three buckets
Stood Flows classifies every licence into one of three buckets:
- Named — fully licensed users with a seat. Salesforce, Salesforce Platform, CRM User, …
- Community Login — community / partner login-pool licences (pooled logins, not per-seat).
- Other — everything else: Identity, Chatter Free, Analytics Cloud Integration, Authenticated Website, etc.
The classification is opinionated and lives in the codebase — it matches how most orgs actually budget. You can see which bucket a licence ended up in next to its name.
Why the buckets matter:
- For Named licences, “Assigned” equals user count: each seat is a real person you pay for.
- For Community Login licences, “Assigned” is pro-rated yearly entitled logins for this analysis period — community logins are a pooled metric, not a per-seat one. A licence with 50 000 entitled logins/year, analysed over a 17-day window, shows ~2 300 as “assigned” for that window.
- Other licences are mostly free or trivially priced; we don’t break out cost in detail there.
Profile columns
| Column | What it is |
|---|---|
| Users | Provisioned users on this profile. |
| Logins (30d) | Users on this profile that logged in within the last 30 days of the analysis period (anchored to analyzedAt, not real-now, so historical numbers stay frozen). |
| Actors | Users on this profile that appear as creator or modifier of a backbone record in the usage analysis window. See below. |
| Assigned | Pro-rated cost (Named) or pro-rated entitled logins (Community Login). |
| Unlogged | Cost (or login-share) attributable to users that didn’t log in at all. |
| Actor $ | Cost attributable to users that are also Actors. |
| Non-actor $ | Cost attributable to users that logged in but aren’t Actors. |
| (business processes) | Click the count next to a profile name to see which business processes the profile is involved in (via its RT visibilities). |
A note on the Actor $ split:
- The three buckets —
Unlogged + Actor $ + Non-actor $— sum exactly toAssigned. - The math accounts for API-only actors: users that produce DML but never log in via UI. Those would otherwise be double-counted (once as Unlogged, once as Actor). The “Non-actor $” line is adjusted so the totals reconcile.
The Actors column
Actors comes from usage-actors.json (written by the Analyze Usage button). The file records, per (object, recordTypeId), the user IDs that created or modified at least one record in the analysis window:
{
  "actors": [
    {
      "objectType": "Opportunity",
      "recordTypeId": "012XXX…",
      "modifierIds": ["005XXX…", "005YYY…"],
      "creatorIds":  ["005ZZZ…"]
    }, …
  ]
}
The panel takes the union of modifier and creator IDs across all (object, RT) entries, intersects them with the user list per profile, and counts.
Actors are usually a strict subset of Logins — a logged-in user doesn’t necessarily do anything. If you see “Actors > Logins” for a profile, you’ve found a profile where API-only integration accounts produce DML without showing up in interactive login logs. That’s a useful flag.
Reading the panel
Two patterns:
“Are we over-licensed?”
Sort the Licenses sub-tab by Available desc. The licences with the biggest gap between Provisioned and Used are your renegotiation targets.
Then on the Profiles tab, expand a high-cost profile and look at:
- Logins (30d) / Users — if a profile has 50 users and 5 of them logged in in the last month, that’s 45 seats up for grabs.
- Actor $ / Assigned — if the actor cost is a small fraction of total assigned cost, the seats may exist mostly as a vanity setting.
“Who actually works in this org?”
Sort the Profiles tab by Actor $ descending within the Named bucket. The top 5-10 profiles are doing the real work. Everything below the long tail is, charitably, optional.
For Community Login orgs, sort by Logins (30d) descending — actors don’t apply the same way since community users may interact via portal in ways that don’t hit Salesforce DML directly. Logins is the better signal there.
Where the numbers come from
| Source | What it feeds |
|---|---|
UserLicense + PermissionSetLicense describes | Inventory rows |
Profile + User describes | Profile membership, user counts |
Login activity on User.LastLoginDate (frozen at analyzedAt) | Logins (30d) |
Pro-rated loginCountByLicense from licensing analysis | Community Login “Assigned” |
usage-actors.json (Analyze Usage output) | Actors |
| User-entered Unit price | All $ columns |
All of it is computed at render time from licensingAnalysis in the version JSON + the usage-actors.json file. Nothing’s hard-coded.
Going deeper — the DML sub-tab
Once you’ve identified profiles that look suspicious in the Profile sub-tab, the DML sub-tab classifies their users into activity buckets based on Event Log Files. That’s its own document — see DML analysis and ELF.
Visits sub-tab
DML can only report what a user wrote. For a read-only population that is almost nothing, and a licence review based on it alone will propose removing people who use the org all day.
Visits reconstructs the other half — the screens people opened, the paths they took through them, how long their sessions lasted — filtered by the same DML categories, so you can ask what the people who write nothing are actually doing. It stores aggregates only: no record ids, no URLs, no IP addresses.
See Visits: what people look at for how it chooses its log sources and how to read its coverage figure.
Groups sub-tab
Public groups and the role hierarchy, with the same columns as profiles: users, logins, actors and the three cost columns. The question it answers is the one profiles cannot: which business unit or team a seat belongs to.
Cohorts sub-tab
Cohorts answers a simpler question than DML: of the people who log in, how regularly do they come back?
For each month it shows how many users logged in at all, split into four engagement bands:
- Daily — logs in almost every working day.
- Weekly — logs in most weeks, but not every day.
- Monthly — logs in at least once a month.
- Infrequent — everyone else: occasional, one-off visitors.
A user’s band is decided by looking back over their recent login history, so it reflects a real habit rather than a single lucky day. A user only counts in a month if they actually logged in that month.
How to read it:
- The stacked bar chart shows the month-by-month trend — a healthy org grows its Daily and Weekly base over time.
- Click a band in the legend to focus on it; hover a licence or profile to exclude it.
- Drill from a band down through licence → profile → user to see exactly who sits where.
- The seasonality view compares this year to last, so summer dips and year-end lulls stand out.
- The latest complete month carries a small up/down arrow versus the month before.
Cohorts only needs login history, so it works even where DML analysis doesn’t — for example community- or portal-heavy orgs.
Credits sub-tab
Credits tracks the consumption-based entitlements Salesforce grants your org — the metered limits and add-on credits such as data storage, API calls and platform events. Take a snapshot to record where each entitlement stands; the panel then shows how much of each you have used against its limit, pro-rated across the period so you can see at a glance whether you are on track or heading for an overage.
Policy sub-tab
Policy helps you act on what the licensing analysis reveals. It previews a deactivation policy — which inactive users would be deactivated under rules you choose — and gives you a ready-to-run Salesforce CLI command to apply it, an enforcement log of what was done, and a CSV export. Each user’s last-modified date is shown so you can double-check before acting. Applying a policy is always your decision and your action; Stood Flows only prepares it.